Algorithmic Identification of Looted Archaeological Sites from Space
 Elijah F. W. Bowen
 Brett B. Tofel
 Sarah Parcak
 Richard Granger
- 1Department of Psychological and Brain Sciences, Dartmouth College, Hanover, NH, USA
- 2Department of Anthropology, University of Alabama at Birmingham, Birmingham, AL, USA
In response to widespread looting of archaeological sites, archaeologists have used satellite imagery to enable the investigation of looting of affected archaeological sites. Such analyses often require time-consuming direct human interpretation of images, with the potential for human-induced error. We introduce a novel automated image processing mechanism applied to the analysis of very high-resolution panchromatic satellite images and demonstrate its ability to identify damage at archaeological sites with high accuracy and low false-positive rates compared to standard image classification methods. This has great potential for large-scale applications whereby countrywide satellite datasets can be batch processed to find looting hotspots. Time is running out for many archaeological sites in the Middle East and elsewhere, and this mechanism fills a needed gap for locating looting damage in a cost and time efficient manner, with potential global applications.
Introduction
Recent estimates indicate that looting at archaeological sites is a worldwide problem (Proulx, 2013): 98% of 2,358 field archaeologists surveyed reported looting at or near their research sites. Recent and ongoing conflicts in Egypt (Ikram, 2013; Ikram and Hanna, 2013) as well as in Syria and Iraq (Pringle, 2014; Gill, 2016) create opportunities for organized looting for profit. While the exact numbers and amounts require more in-depth research (Chulov, 2014; Felch, 2014), it is clear that widespread damage to ancient sites and monuments is occurring as a result of looting and damage from war. In response, such looting and damage is monitored manually using space-based radar (Tapete et al., 2016), repeat visits from commercial imaging satellites (Parcak, 2007, 2009; Hritz, 2008; Stone, 2008; AAAS, 2014; Casana and Panahipour, 2014; Newson and Young, 2015), or from free public resources such as Google Earth (Thomas et al., 2008; Contreras and Brodie, 2013). However, manual analysis can be expensive, time intensive, difficult to replicate, and gappy. In addition source data can contain hundreds of megapixels. For example, a new looting mapping study used all the publicly available satellite imagery of Egypt to map looting from 2002 to 2013 across 1,200 “sitescapes” (with each site landscape containing one to hundreds of sites) (Parcak et al., 2016). It took 6 months of manual assessment to draw over 200,000 individual looting pits, with thousands of additional polygons around sites or features of interest. Even with high-resolution data at <1 m/pixel resolution, expertise is required to discriminate between looting pits and modern holes or excavation units. Since looting is increasing across the globe, we need an algorithmic early warning system to focus human monitoring and intervention toward sites of interest in protection and preservation of ancient sites.
As others have done in illegal construction monitoring (Hofmann, 2001; Hofmann et al., 2008; Ioannidis et al., 2009), we cast illegal looting pit detection as a change detection task, wherein the goal is to detect new looting pits and not preexisting pits or new instances of other categories. Approaches to satellite-based change detection often fall into one of two categories: those which classify pixels in the difference image and those which compare two images post-classification [for details, see Singh (1989), Mas (1999), Coppin et al. (2004), and Lu et al. (2004)]. Difference-image-based methods require very strict pixel alignment between images (e.g., Dai and Khorram, 1998). This requirement is problematic when using very high-resolution imagery, multiple sensors, and differing photographic angles. Difference-image-based methods are commonly insensitive to variations in the types of change that occur (Bruzzone and Prieto, 2000), making them susceptible to moving shadows, seasonal changes, and displaced objects such as sand dunes or re-parked trucks. Additionally, difference images are greatly impoverished by the removal of non-changing structures. This is fundamentally limiting; non-changing structures may still be good exemplars of the emergent targets and distractors, and modeling these structures may enhance the identification of targets.
Post-classification analysis exposes the entire scene of each image to processing and has become a popular approach. We take this approach to change detection here. Human-supervised classifiers, such as support vector machines (SVMs), have proven popular for the classification step, as well as for other topics in remote sensing. For example, Pal and Mather (2005) evaluated SVMs against maximum likelihood and artificial neural network classifiers trained to recognize land cover types in multispectral satellite data. They found that each classifier was successful, while SVMs were the superior choice. Mountrakis et al. (2011) describe a sharp increase in the application of these methods in recent years, particularly to ground cover classification using multispectral data. Ballabio and Sterlacchini (2012) go so far as to train an SVM classifier to predict regions susceptible to landslides in the future. Despite the popularity of supervised classifiers for change detection tasks on geographic information system (GIS) images, we will show that, for our particular task, our proposed partially supervised algorithm is superior: it produces better accuracy and false-positive rates while modeling unsupervised categories in the data, as well as localizing them.
Sophisticated unsupervised and partially supervised alternatives have recently gained traction. If each pixel or pixel neighborhood in the image is considered to be a data point, K-means clustering (Hartigan and Wong, 1979; Rekik et al., 2006) or a linear regression model (Galton, 1894; Zhang et al., 2011) can be used to separate out groups of changed and unchanged pixels, and principal component analysis can be effectively used to prepare the data (Celik, 2009a). Scientists have used the kernel trick (Camps-Valls and Bruzzone, 2009) to improve performance by creating non-linear classifiers. For example, one group clustered a preselected set of changed and unchanged pixels using kernel K-means, then assigned new pixels to categories using their one nearest neighbor (1NN) (Volpi et al., 2012b). Others studies have used K-means on the undecimated discrete wavelet transform of the images, as well as a genetic algorithm to minimize the within-class errors of “changed” and “unchanged” assignments with equivalent effectiveness (Celik, 2009b, 2010). Each of these algorithms fails to build a generative model of the data and, therefore, is unlikely to build the detailed decision boundaries required for the classification of looting pits against a landscape of myriad structural distractors.
Partially supervised or unsupervised approaches can be improved with a variety of models. Bruzzone and Bovolo (2013) propose the manual creation of a tree-like hierarchical model of all changes expected to occur across images for the purpose of modeling both desired and undesired changes. Modeling the underlying data structure using unsupervised clustering often improves supervised classifier performance. For example, one group used K-means clusters to select data points for which human feedback might improve an SVM classifier (Liu et al., 2008). More recently, Volpi et al. (2012a) used a similar approach to select data points for human feedback using hierarchical K-means and an adaptive heuristic. The search for looting pits among multiple instances of desert and urban targets using a minimal dataset is especially demanding of a model-based approach. However, modeling the entire set of observed objects requires a prohibitively large dataset. The software of eCognition (Hofmann, 2001; Hofmann et al., 2008) is capable of simultaneously modeling color histogram objects at multiple scales and segmenting the image to localize them. Localization aids in unsupervised object discovery by removing irrelevant pixels from each category prototype, performing feature selection. However, because eCognition’s approach to this task ignores structural information and is fundamentally unsupervised, it cannot be guided to identify relatively few looting pit structures among numerous instances of so many distractor classes. Ioannidis et al. (2009) describe an algorithm to identify new buildings in a rural environment. The authors identified changed buildings using a knowledge-based approach on stereo images to categorize “ground” vs “above-ground,” but only after they used a number of tricks to eliminate false positives (FPs) by increasing the ratio of target and non-target pixels. In a common pattern, these algorithms either attempt to model all observed classes or only the classes of interest.
We propose a novel categorization scheme and its use as the central component of a post-classification analysis technique for change detection. Our algorithm is derived from hierarchical clustering performed by the brain for use in the identification of repeated structurally consistent small-scale targets among many repeated distractors. Our approach improves the identification of a specific category of observation by modeling numerous categories. It avoids modeling all potential object categories by only modeling those relevant to the distinctiveness of the target. It localizes instances of each observational category in order to ignore uninformative pixels. It accomplishes this using only the positions of members of the relatively rare target category as supervised labels and avoids the need for costly human intervention for parameter tweaking or resolution of high false-positive rates. Finally, it may exemplify the first algorithm for satellite-based identification of structurally consistent ground feature changes for archaeology.
In the following sections, we introduce our algorithm based on recently developed image analysis methods for recognition and localization (Chandrashekar and Granger, 2012; Chandrashekar et al., 2014). We apply our algorithm to a large (239 million pixel) satellite image of the pyramid field zone in Egypt, where organized looting of burial sites is ongoing (Figure 1). We show cross-validated success and false-alarm rates for looted pits and compare these directly against SVM on bags of visual words, a standard method for classification in satellite imagery and other fields.
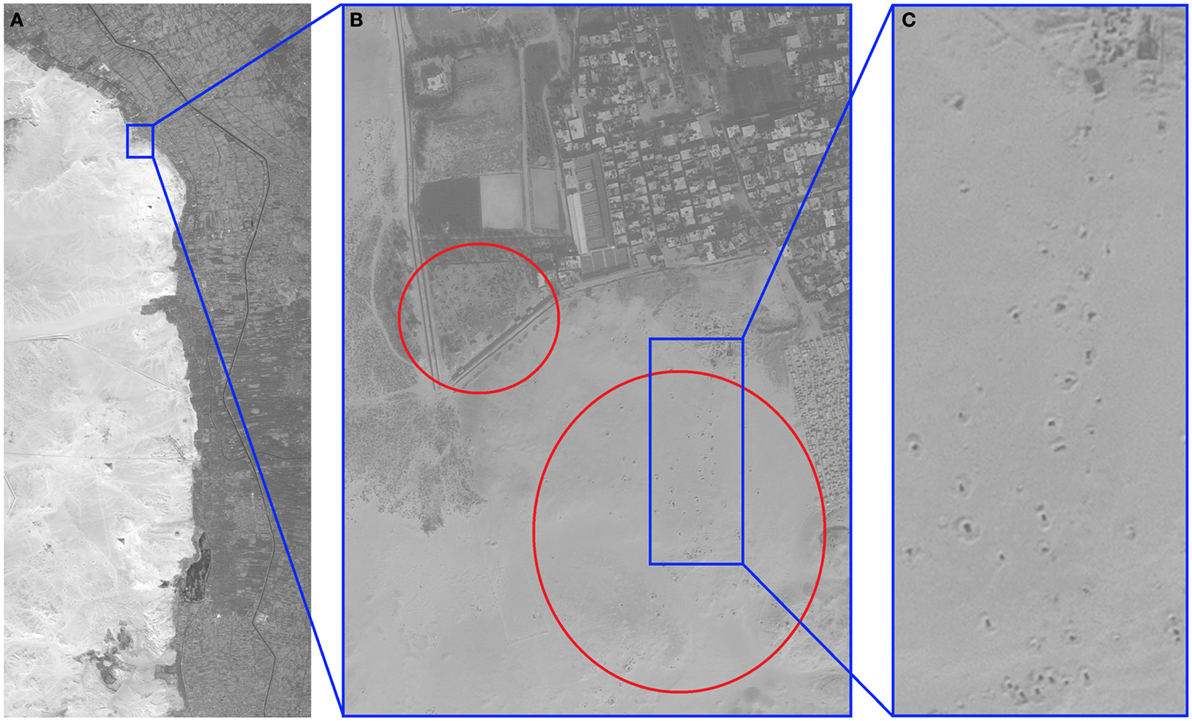
Figure 1. Satellite image from Saqqara desert, Egypt. Mean ground sample distance 0.71 m. (A) Full image (10,148 × 23,561 pixels) of border between unsettled desert and populated regions (see text). (B) Close-up of region indicated by outline in panel (A), in 2011, in which evidence of looting can be seen (small dark spots in circled regions). (C) Close-up of several looting pits. All relevant permissions have been obtained for figure publication.
Algorithm Description
The new hierarchical categorization and localization (HCAL) algorithm introduced here is a method for partially supervised classification and localization, derived from previous work on partially supervised classification alone (Chandrashekar and Granger, 2012) and on unsupervised localization alone (Chandrashekar et al., 2014). The resulting algorithm clusters images by similarity while simultaneously identifying image regions likely to contain examples of these clusters. It then successively narrows category descriptors for these images until they identify specific features that constitute target images of disrupted archaeological burial sites or usefully discriminable non-target objects.
Intuitively, the HCAL algorithm first identifies repeated featural motifs occurring in the set of images using unsupervised methods, thus localizing candidate feature sets. It then (again without supervision) categorizes images based on similarity. Finally, the members of these similarity-based categories are checked for mismatching (supervised) labels—the first time supervised information is referenced. When mismatched labels are found (such as a category containing both looting pits and other objects), the algorithm hierarchically splits categories again in a purely unsupervised manner. This method is repeated until clusters contain purely pit images, purely non-pit images, or very few (e.g., 7) images. The resultant data structure contains hierarchical categories of image regions, with leaves of the hierarchical tree corresponding to subcategories each sharing a common supervised label. The use of unsupervised splits causes the HCAL algorithm to learn the structural model of the data, enabling more intelligent decision boundaries than supervised learning alone. Figure 2 provides a flowchart and pseudocode for the algorithm.
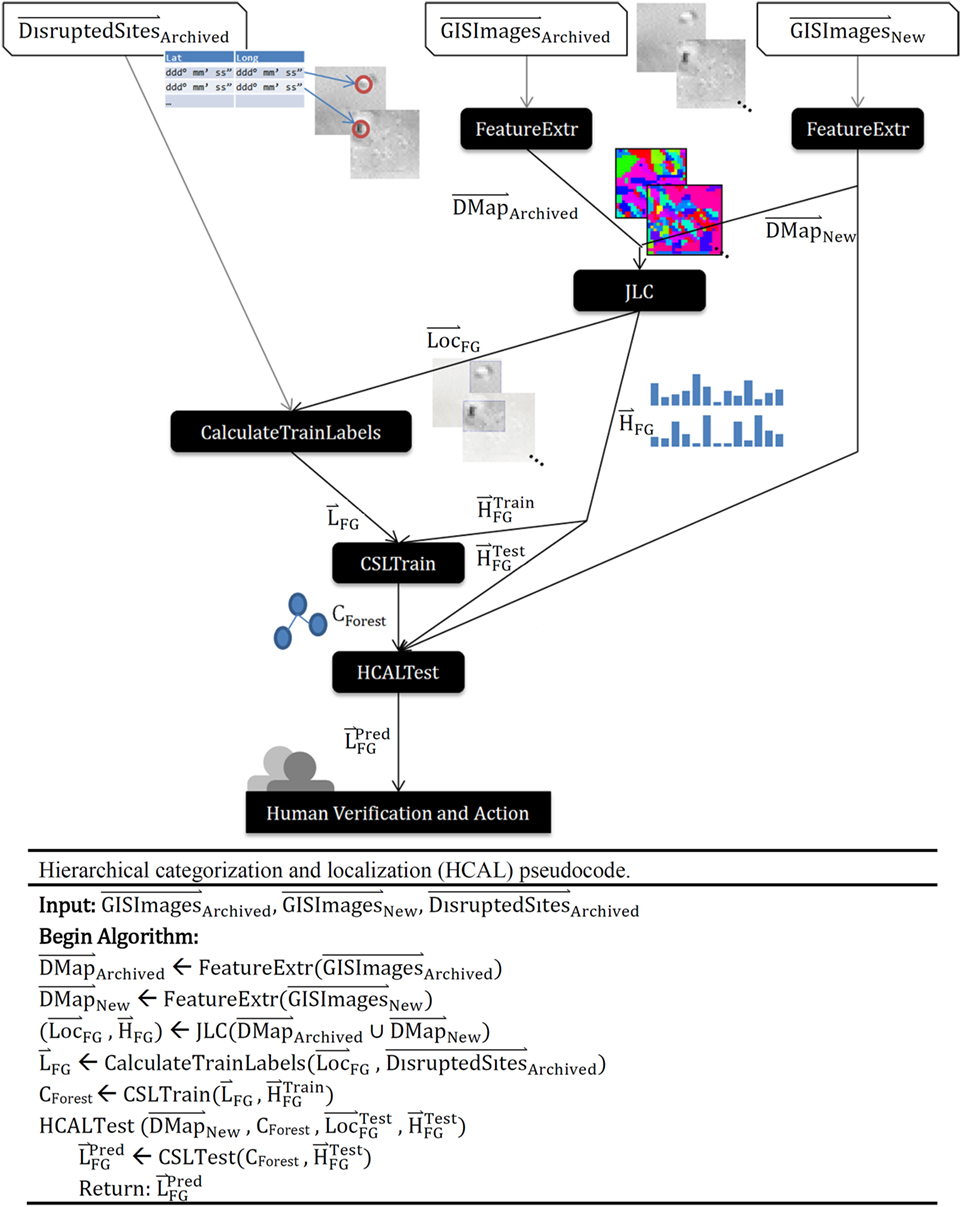
Figure 2. Hierarchical categorization and localization (HCAL) flowchart and pseudocode. contains a list of coordinates for known disrupted burial sites. The joint localization and classification algorithm (JLC) receives a document map (), a set of subphotos from preselected training satellite images. JLC returns , the location of those labeled items in global coordinates, and , the histogram of foreground pixel values. CSLTrain returns CForest, the data structure representing the hierarchical clustering solution. HCALTest receives CForest as a representation of what was learned, and , a set of tiled subphotos from new “test” satellite observations—the data to analyze. When HCALTest completes, it has generated , a list of labels for each subphoto.
Training Steps
The four training steps of the HCAL algorithm can be summarized as follows:
1. GIS data from a site of interest are split into numerous small images. For each image, we extracted features from each image using a process similar to Chandrashekar et al. (2014). Dense scale-invariant feature transform (SIFT) (Lowe, 2004), histogram of oriented gradients (HOG) (Dalal and Triggs, 2005), or speeded up robust features (SURF) (Bay et al., 2008) created a high-dimensional representation of each pixel. Clustering each image using K-means produced a 40 cluster solution in pixel feature space. Finally, we clustered the set of all means (40 per image) with K-means to produce a 40 cluster vocabulary of visual words in pixel feature space for the entire training dataset and renumbered the pixels for each image with its closest cluster as identified via nearest neighbor. Each image can be thus viewed as a document of visual words (Chandrashekar et al., 2014). A document map () was then created wherein each pixel was labeled based on the vocabulary word representing its feature. Based on the comparison of overall algorithmic performance on several different mean sizes, we determined our choice of 40 means analytically, and may be increased for application to more complex urban datasets.
2. The (unsupervised) joint localization and classification algorithm (JLC) is performed on the set of archived and newly processed images (), producing three data structures: (i) , which is the location of an image’s region that is believed to contain the “foreground” object (expected to recur in the images) and (ii) the histogram of features occurring within that region (a bag of visual words). This expectation–maximization algorithm finds K-means cluster centroids in the feature histograms for each image, then redefines the foreground of each image to best match its cluster’s centroid. Each image’s histogram is redefined using only foreground pixels, and the process repeats; see Chandrashekar et al. (2014).
3. Foreground locations identified by the JLC subroutine are compared with a list of known locations for disrupted burial sites (DBSs) and labeled based on whether one or more looted sites are present in the foregrounds.
4. The semi-supervised CSL classification algorithm (Chandrashekar and Granger, 2012) is applied to the set of pairs of image-foreground histograms and supervised labels (DBS/non-DBS) corresponding to each such histogram. The CSL algorithm generates a tree (or forest of trees) in which each node performs unsupervised K-means clustering. For each cluster in the root node containing members of more than one supervised label, a child node is created. This child node is passed as data only the members of that cluster. The process recurses until leaf nodes each contain members of only one category label. Refer to Figure 3 for pseudocode. Since the maximum number of child nodes that can be created at any node is equal to the number of clusters, the branching factor (BF) of this tree is equal to K (the number of means) in K-means. The time complexity of this training algorithm is O(NK), where N is the number of images and K is the number of means. Space complexity is the same (Chandrashekar and Granger, 2012).
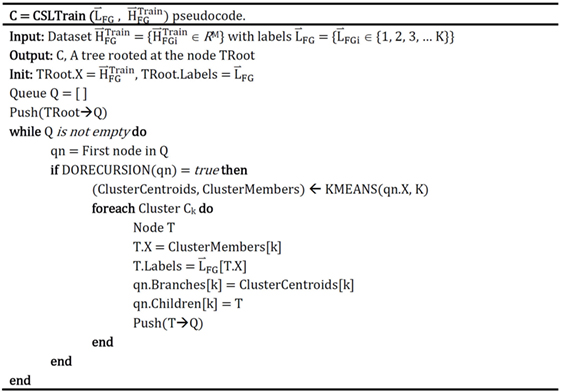
Figure 3. Pseudocode for the CSLTrain component of the algorithm, derived with permission from Algorithm 1 of Chandrashekar and Granger (2012).
Testing Step
The HCAL procedure to evaluate new data can be summarized as follows:
1. For each run, we tested the CSL algorithm on hold-out images not originally part of the training set; what is returned is the set of predicted labels that correctly and incorrectly classified as DBS. In the root node, each data point is assigned to its nearest cluster and is recursively passed to the corresponding child node. This repeats until the data point enters a leaf node, where it is assigned a label based on the label of training points assigned that leaf node during training. Since this approach amounts to a traversal from the root node to a leaf, in a full tree the time complexity is log-linear. Using a simple voting scheme, multiple trees can be combined in a random forest. For this experiment, we used repeated random subsampling to generate validation/test sets (see “Materials and Methods”).
Contrasts with Prior Art
Many categorization techniques customized to change detection in very high-resolution satellite imagery are not directly applicable to the task at hand. Looting pits are defined by their structure, so pixel-based, texture-based, or multispectral methods will not work. Distractors are numerous, and both targets and distractors are varied, so fully unsupervised methods are likely to fail. These limitations leave few options in the prior art fit for comparison. However, our method can be contrasted with supervised methods such as the SVM, one of the most widely used statistical classification methods for remote imaging and other data, in two key ways: (i) SVMs classify entire input images, without localizing those features within the image which are most responsible for the classification and (ii) whereas SVMs laboriously (and computationally expensively) construct a “separator surface” containing all of one category on one side of the separator (in high-dimensional input feature space) and the other category on the other side, the HCAL algorithm simply identifies regional volumes in the space containing similar looking data, and iteratively sub-partitions those volumes whenever they contain mismatching labels. More fine-grained splits are performed only where necessary. The HCAL’s CSLTrain mechanism is estimated to cost roughly an order of magnitude less in terms of time complexity than SVMs [for evidence, see Chandrashekar and Granger (2012)]. Here, we will compare against an SVM with linear, quadratic, and cubic polynomial kernels (see “Materials and Methods”), and against Naïve Bayes and linear discriminant analysis (LDA) classifiers.
Data
The primary dataset used in the current study included a set of satellite images from the pyramid fields region of Egypt, captured by the EROS-B1 satellite at a panchromatic mean ground sample distance (spatial resolution) of 0.71 m per pixel. A large (3,200 × 4,300 pixels) region was tested. This region contains multiple instances of looted burial sites, substantial expanses of open desert, and multiple distractors such as farmland, buildings, modern (non-archaeological) graveyards, and military bases with bomb craters. Like many similar approaches to the monitoring of structural objects (e.g., Wei et al., 2004; Sirmacek and Unsalan, 2009), we restrict analysis to grayscale images to demonstrate broad applicability across high-spatial-resolution commercial satellites many of which are panchromatic in high resolution (e.g., GeoEye-1, WorldView-2 and 3, and Ikonos). Luminance was normalized across the entire dataset to improve dynamic range.
Materials and Methods
Our team split the very high-resolution satellite data into tiled images of dimensions 30 × 30 pixels with an overlap of 10 pixels to ensure that features on the scale of looting pits (generally smaller than 10 pixels in diameter) could be intact in at least one image. From these images, 300 looting sites and 2,000 other locations were randomly sampled for use (visualized in Figure S1 in Supplementary Material). This unbalanced ratio better mimics real world conditions, wherein looting pits cover only a small fraction of the land mass. To better take advantage of the limited number of training examples, we reduced the number of training images without looting pits to equal the number of training images with pits for the supervised components of the algorithm (CSLTrain). Human experts identified initial sets of DBSs for training and validation manually, with crosschecking by multiple trained participants.
We ran JLC with an a priori expectation of 32 clusters of images being present in the dataset. JLC-utilizing bounding boxes incorporated a tree-based pyramid search for the optimal rectangle. Using superpixel-based localization (sample localizations in Figure 4; results in Figure S2 in Supplementary Material), JLC identified a contiguous combination of superpixels, which together produced the most likely feature histogram most likely to belong to a cluster. Superpixels resulted from an over-segmentation of the image; most objects are assumed to be comprised of numerous adjacent superpixels. Readers may refer to Chandrashekar et al. (2014) for more details. While the degree of segmentation in this study was hand-tuned to over-segment desert scenes, interesting future work would be to apply an adaptive segmentation technique, such as fuzzy binarization applied in Santosh et al. (2016) to automatically identify the optimal degree of over-segmentation based on weather conditions.
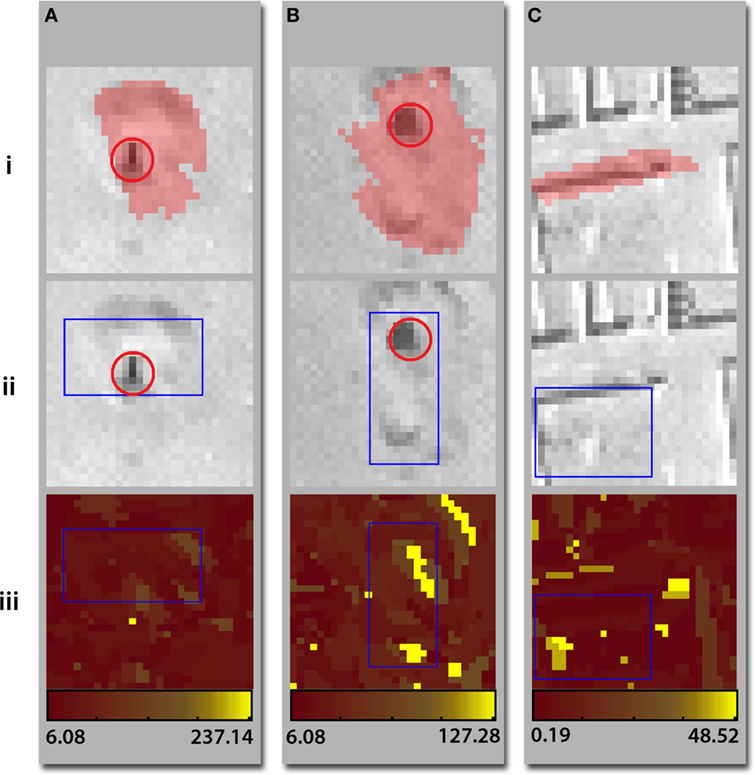
Figure 4. Localization results for three example satellite image patches. Top row: superpixel-localized regions. Middle row: bounding box-localized regions. Bottom row: heat maps of the same images wherein brighter colors indicate the location of features more indicative of the subimage’s similarity cluster. Red circles mark human-localized looting pits. Examples (A) and (B) contain looting pits, while example (C) contains structural walls, with no graves or looting pits present.
CSLTrain was implemented with a forest of 100 CSL trees wherein each node of each tree attended to a randomly selected 20% of the 40 available feature histogram dimensions. We chose branching factors of 2 and 6 from an exploration of the relative accuracies of many branching factors. In this case, accuracy peaks just above a branching factor of 2, and falls off if the branching factor is increased further. Practically, many branching factors performed acceptably. Leaf nodes claiming less than seven data points did not include splitting and, instead, had labeling as looting pits based on whether the majority of their data points contained one or more pits. We recombined the final results for CSLTest using a simple voting scheme. Our team performed each validation trial by randomly selecting 2,300 unique images (300 with looting and 2,000 without) with replacement between trials. Within each trial, we selected unique random initializations for JLC and CSLTrain, each of which functions via error reduction from an initial state. Results for each trial are the mean across 3 different random initializations, each of which is scored as the mean results of CSLTrain across 10 bootstrapped samples. Two algorithms are compared; CSL on the outputs of JLC and SVM (linear, quadratic, and cubic kernels) on bags of visual words representing the original images. In Figure S3 in Supplementary Material, we also compare CSL on the outputs of JLC against SVM (linear, quadratic, and cubic kernels), LDA, and Naïve Bayes on the outputs of JLC in place of CSLTrain and CSLTest.
Results
We trained HCAL and comparison algorithms on random subsamplings of the data for cross-validation (see “Materials and Methods”). Results of identification and localization are shown for a Dashur satellite image (Figure S1 in Supplementary Material). The HCAL algorithm can operate in either bounding box localization mode or superpixel localization mode. Localization of looting pits within images appeared reasonable in both localization modes. It is important to re-note that HCAL always localizes the most likely object in the image given the other images, regardless of its supervised label.
Figure 5 illustrates the statistical findings using SIFT features and bounding boxes for localization. Figure 5A shows the accuracy of predictions made by the HCAL method introduced here and by SVM trained on a simple bag of visual words run on the original images using the same visual vocabulary. In the SVM case, linear, quadratic, and cubic kernels were evaluated (see “Materials and Methods”). The HCAL method outperforms the SVMs. Shown in Figure 5B are accuracy measures given a varying percentage of the data used for training (from 20 to 90%). It can be seen that the HCAL method reliably outperforms linear SVMs by 2–4 accuracy percentage points for all sizes of training data used. A receiver operating characteristic plot (Figure 6) shows that HCAL results (again, SIFT features and bounding box localization) are competitive with the results of linear SVMs not only in terms of accuracy of prediction but also in terms of low false-positive rates (14.62 ± 0.18% for HCAL with a branching factor of 2; 14.96 ± 0.17% for HCAL with a branching factor of 6; 17.75 ± 0.06% for linear SVM). Using SIFT features, HCAL with a branching factor of 2 scores an accuracy of 85.33 ± 0.16 against linear SVM’s 82.11 ± 0.06. Results are similar using SURF features. Accuracy is reduced across the board using the less descriptive but more concise HOG features, although HCAL still outperforms SVM in this case (Figure S2A in Supplementary Material). We also tested superpixel-based localization, which generally performed more poorly; see Figure S2B in Supplementary Material for details. Examples of typical localization results are available in Figure 4. Resultant tree structures are available in Figure S4 in Supplementary Material. See Figure S6 in Supplementary Material for a large number of localization examples for the bounding box localized SIFT feature condition.
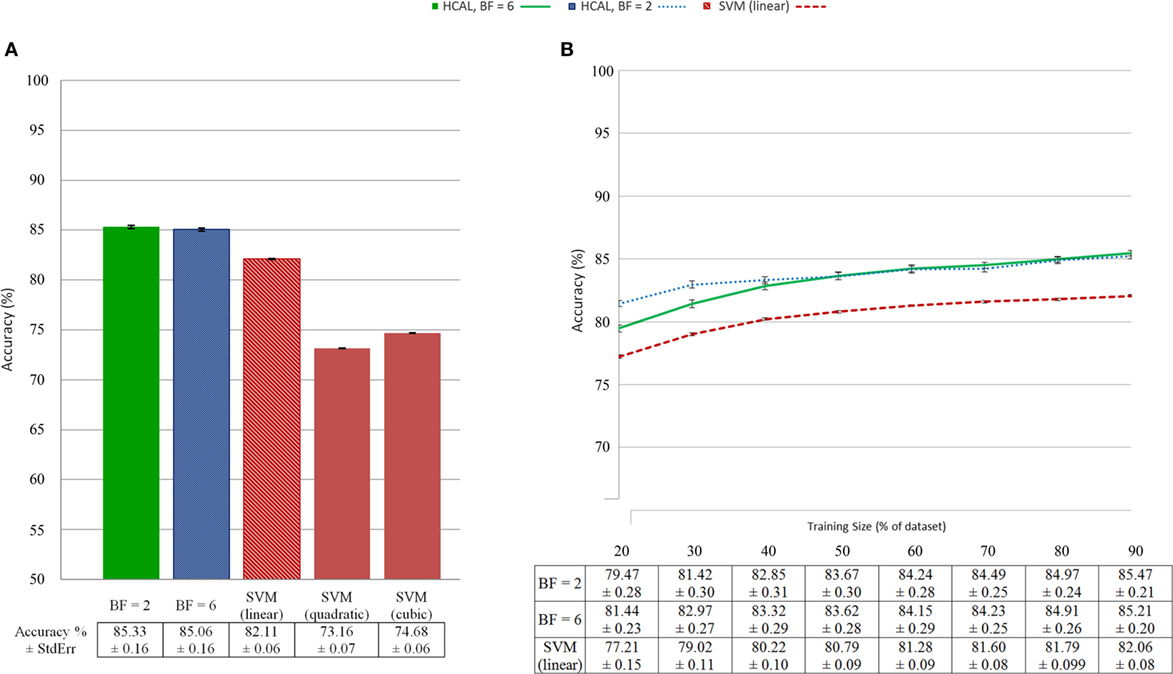
Figure 5. (A) Predictive accuracy using a bounding box localizer with scale-invariant feature transform (SIFT) features for the frontend, N = 100 per SE bar; (B) predictive accuracy for support vector machine (SVM) and hierarchical categorization and localization (HCAL) as a function of number of training examples, using identical parameters (N = 50 per SE bar).
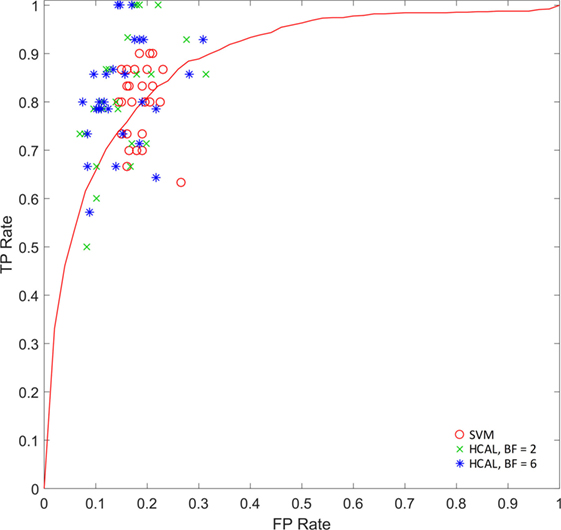
Figure 6. Disrupted burial site (DBS) correct identification rate vs false-alarm rate. Results generated using scale-invariant feature transform features with bounding box localization from one complete trial (tested using 3 random initializations, 10 bootstrapped train/test splits each). Correct identification rate, also known as sensitivity or true positive (TP) rate, is measured as the number of positive “DBS is present” responses from the algorithm divided by the total number of images of DBSs. False-alarm rate, or false positive (FP) rate, equals the number of negative “no DBS present” responses from the algorithm divided by the total number of images without DBSs. A position in the top left of a receiver operating characteristic (ROC) plot such as this is desirable because it indicates that all DBSs were located, while no distractors were mistaken for DBSs. For comparison, co-displayed are 30 runs on the same images for SVM (linear kernel) and the SVM receiver operating characteristic curve (calculated using 10-fold cross-validation).
Discussion
The HCAL algorithm outperforms SVM regardless of branching factor used. This is a reflection of the importance of localizing repeated features, further enhanced by HCAL’s ability to model the hierarchical substructure of the data in order to create more intelligent decision boundaries. Meanwhile, the algorithm can run on a commodity workstation, making it affordable for wide-scale implementation.
As our data show both SVM and HCAL perform better on SIFT- and SURF-transformed images than on HOG. This was found to be true anecdotally for several other feature transforms as well. Two factors could underlie this difference. First, subpar localizations during the JLC stage could forestall class separability during CSLTrain by excluding regions or including distractor pixels. However, this would not explain the reduced performance in SVM results, where localization was not performed. Alternately, the DMap histograms () generated from those localizations could be less informative due to the impoverished feature information encoded in HOG descriptors. This explanation seems more likely.
One of the primary driving factors of algorithm selection for this problem domain is the ability to function on a minimal set of supervised labels. HCAL accomplishes this by modeling the data generatively and not requiring labels for the various and plentiful non-target classes. Multiple subclasses of a target class can be modeled separately, and each can differentiate from each non-target class with unique decision boundaries. These boundaries are not limited to linear functions due to the hierarchical nature of the CSL step. This same feature also reduces overfitting. With each hierarchical split of the data during CSLTrain, a very simple classifier is created (K-means and 1NN). Since purely disrupted burial site (DBS) and purely non-DBS clusters are never split again, the model avoids unnecessary complexity.
As can be seen in Section “Results,” HCAL remained superior to SVM as the training dataset shrunk. In the 20% training case, HCAL was able to build a forest of differentiating trees superior in accuracy to SVM using as few as 32 example images. The false-alarm rate for the HCAL algorithm is quite low, as is the FP rate for SVM utilizing the JLC prestep. This is in contrast to competing algorithms for this problem domain, which often encounter many FPs, an understandable issue given the ratio of target to non-target images. Although unnecessary, additional reductions to the false-alarm rate could be achieved by training the same algorithm on some of the most common non-target categories and removing instances of those categories from the dataset. The low false-positive rate of the HCAL method is of particular interest when attempting to minimize human intervention in the automated monitoring of archaeological sites over extended time periods.
We performed an additional evaluation (Figure S3 in Supplementary Material) of predictive accuracy using SVM (linear, quadratic, and cubic kernels), LDA, and Naïve Bayes in place of the CSL step. Direct comparison of these algorithms with the CSL step is of minor interest, since only CSL learns the hierarchical generative structure of the data, enabling it to model multiple DBS and distractor appearance classes. Results indicate that, while CSL is often the top performer, accuracy is not as strongly tied to this choice—what matters most is the JLC localization phase.
To our knowledge, the localizations generated by HCAL are unique in this problem domain. All existing segmentation approaches identify extents of an image based not on structural information but based on edges, keypoints, texture, or spectral content (e.g., Kass et al., 1988; Agouris et al., 2001; Hofmann, 2001; Wei et al., 2004; Mayunga et al., 2005; Peng et al., 2005; Hofmann et al., 2008; Opitz and Blundell, 2008; Sirmacek and Unsalan, 2009). By contrast, HCAL operates on remote sensing data by searching for structural configurations (as described in Section “Algorithm Description”) that have been identified. Of equal interest is the subsequent ability of the method, once it has found a structural object, to then successively identify more fine-grained localizations (see “Training Steps” and “Testing Step”), greatly facilitating identification of regions of experimenter interest.
Under certain conditions, HCAL can miss looting pits. In images where multiple instances of the same object are present, the algorithm will often localize a subset of the instances. This is likely due to the algorithm’s requirement that localizations take the form of a contiguous superpixel or box. Adding, to the histogram, the desert sand between DBSs would be detrimental to forming a good match, but averaging another DBS into an existing DBS histogram changes it little. In practice, the task of identifying looted regions with ongoing additional looting can be accomplished by masking previously identified looting pits.
A variant of the algorithm using superpixel-based localizations rather than bounding boxes was also analyzed (Figure S2B in Supplementary Material). Under such a scheme, the HCAL algorithm still performed reasonably well but found difficulty surpassing SVMs in the SIFT feature case. Superpixel-based localizations can form complex concave regions. These regions can wrap around a disrupted burial sites, capturing much of the pixels indicative of disruption, without covering the human-marked location of disruption. This could lead to DBS-negative exemplars containing DBS features. This problem is perhaps specific to a point-based supervisory labeling system, so further work is required to ascertain the impacts of localization boundaries on HCAL. The superpixel segmentation itself, performed as preprocessing step prior to all other tasks, could easily be supplemented to expand superpixel boundaries into convex regions, helping to guide superpixels toward selection of the entire looting pit.
Minimal parameter tuning is required to reach near-optimal results with HCAL, in contrast with existing methods. The most important parameters in this algorithm are the vocabulary size from which to generate , the number of generative classes to expect when localizing, and the branching factor of the CSL step. We chose a vocabulary size of 40, since it is slightly superior to other explored sizes such as 20 or 80. Future work might find improved performance by fine-tuning this parameter. We explored the use of 16, 32, or 64 generative classes for localization. The difference in accuracy was minimal, so we report results for 32 classes here. Branching factor makes a substantial difference, and numbers for two branching factors, 2 and 6, are reported side-by-side. Figure S5 in Supplementary Material supplies accuracies for each of the mentioned parameter choices.
Presented here is a complete solution for target category identification in remote sensing imagery. However, the broader goal is to enable fast response to archaeological looting by academic institutions across the globe. The authors propose a system by which satellite images of each site of interest are downloaded at regular intervals (weekly or monthly depending on the risk of looting to the site and ongoing damage assessment), and each image is analyzed for looting pits. Each new image is compared with the category labels (DBS/non-DBS) of previous views of the same coordinates, and new DBSs are forwarded to humans for confirmation and action. Confirmed looting pits might be added to a supervised dataset for future retraining of the algorithm. This solution also has applications across entire countries where looting patterns are similar. While our error rates might be greater due to an increased number of land classifications units, our process would pick out looting hotspots for individual site inspection. This would effectively cut out the most time-consuming process of looting mapping for an entire country: scanning each site individually and over time. Our proposed solution would also pick out looting hotspots at unknown sites (i.e., not in national archaeological site databases or GISs), facilitating both new site registration and site protection.
Conclusion
The novel HCAL algorithm presented here is an ideal candidate for VHD satellite image analysis when the goal is to identify numerous instances of target categories among many distractors using minimal human intervention and training data. We first acquire numerous grayscale VHD satellite images from an archaeological site of interest, some of which contain looting pits and many which do not. These images are grouped by structural content using unsupervised clustering while simultaneously localizing the regions in each image which contain structural content associated with the image’s cluster. We then train a hierarchical model of the data consisting of multiple categories, some of which are labeled as containing pits based on human labeling. Numerous future images can be labeled as containing looting pits based upon the same system, and results can be compared with previous data. Changes in labels (not at the pixel level, but at the image level) can be flagged for human confirmation and intervention. These new images can be combined with archival images to increase the power of the model for future predictions. We have shown that this system works well throughout multiple tested subregions of an archaeological site in Egypt, producing advantageous false-positive rates despite the large number of distractors. HCAL is the first algorithm of its type to be applied in the defense of archaeological sites from human intervention. It has minimal parameters, making it easy to apply to new regions. We speculate that it will have high value as a tool across a broad range of unforested sites at risk for looting. While the methodology presented here does not have an accuracy of 100%, it could be applied across satellite datasets of an entire country, finding the majority of total sites affected by looting (both known sites and previously unknown sites). Finding the actual sites affected by looting is the most time consuming process of a countrywide analysis. We simply do not have a good sense of the total numbers of sites affected by looting in the Middle East, nor do we have an efficient way of monitoring countrywide satellite data to alert authorities. This automated approach is at present the best tool for rapid analysis of large-scale site looting.
Author Contributions
Substantial contributions to conception or design of the work; drafting the work or revising it critically for important intellectual content; final approval of the version to be published; and agreement to be accountable for all aspects of the work in ensuring that questions related to the accuracy or integrity of any part of the work are appropriately investigated and resolved: RG, EB, BT, and SP.
Conflict of Interest Statement
The authors declare that the research was conducted in the absence of any commercial or financial relationships that could be construed as a potential conflict of interest.
Funding
This project was funded by the National Geographic Society, the National Science Foundation (OISE-1103878), D. Lehr and the Antiquities Coalition, and the University of Alabama at Birmingham, and supported in part by grant N00014-15-1-2132 from the Office of Naval Research and grant N000140-15-1-2823 from the Defense Advanced Research Projects Agency. SP would like to thank the Ministry of Antiquities in Egypt for their support, including M. Damaty, H. el-Azm, K. Waheed, M. Ali, and A. Ahmed.
Supplementary Material
The Supplementary Material for this article can be found online at https://www.frontiersin.org/article/10.3389/fict.2017.00004/full#supplementary-material.
Abbreviations
BF, branching factor; DBS, disrupted burial site; HCAL, hierarchical categorization and localization (this algorithm); 1NN, one nearest neighbor classification; GIS, geographic information system; PCA, principal component analysis; ROC, receiver operating characteristic; SVM, support vector machine.
References
AAAS. (2014). Ancient History, Modern Destruction: Assessing the Current Status of Syria’s World Heritage Sites Using High-Resolution Satellite Imagery. Available at: http://www.aaas.org/page/ancient-history-modern-destruction-assessing-current-status-syria%E2%80%99s-world-heritage-sites-using
Agouris, P., Stefanidis, A., and Gyftakis, S. (2001). Differential snakes for change detection in road segments. Photogramm. Eng. Remote Sensing 67, 1391–1400.
Ballabio, C., and Sterlacchini, S. (2012). Support vector machines for landslide susceptibility mapping: the Staffora River Basin case study, Italy. Math. Geosci. 44, 47–70. doi: 10.1007/s11004-011-9379-9
Bay, H., Ess, A., Tuytelaars, T., and van Gool, L. (2008). Speeded-up robust features (SURF). Comput. Vision Image Understand. 110, 346–359. doi:10.1016/j.cviu.2007.09.014
Bruzzone, L., and Bovolo, F. (2013). A novel framework for the design of change-detection systems for very-high-resolution remote sensing images. Proc. IEEE 101, 609–630. doi:10.1109/JPROC.2012.2197169
Bruzzone, L., and Prieto, D. F. (2000). Automatic analysis of the difference image for unsupervised change detection. IEEE Trans. Geosci. Remote Sensing 38, 1171–1182. doi:10.1109/36.843009
Camps-Valls, G., and Bruzzone, L. (2009). Kernel Methods for Remote Sensing Data Analysis, Vol. 2. West Sussex: John Wiley and Sons.
Casana, J., and Panahipour, M. (2014). Satellite-based monitoring of looting and damage to archaeological sites in Syria. J East. Mediterr. Archaeol. Heritage Stud. 2, 128–151. doi:10.5325/jeasmedarcherstu.2.2.0128
Celik, T. (2009a). Unsupervised change detection in satellite images using principal component analysis and-means clustering. IEEE Geosci. Remote Sensing Lett. 6, 772–776. doi:10.1109/LGRS.2009.2025059
Celik, T. (2009b). Multiscale change detection in multitemporal satellite images. IEEE Geosci. Remote Sensing Lett. 6, 820–824. doi:10.1109/LGRS.2009.2026188
Celik, T. (2010). Change detection in satellite images using a genetic algorithm approach. IEEE Geosci. Remote Sensing Lett. 7, 386–390. doi:10.1109/LGRS.2009.2037024
Chandrashekar, A., and Granger, R. (2012). Derivation of a novel efficient supervised learning algorithm from cortical-subcortical loops. Front. Comput. Neurosci. 5:50. doi:10.3389/fncom.2011.00050
Chandrashekar, A., Torresani, L., and Granger, R. (2014). Learning what is where from unlabeled images: joint localization and clustering of foreground objects. Mach. Learn. 94, 261–279. doi:10.1007/s10994-013-5330-2
Chulov, M. (2014). “How an arrest in Iraq revealed Isis’s $2 bn jihadist network,” in The Guardian, Vol. 15. Available at: http://www.theguardian.com/world/2014/jun/15/iraq-isis-arrest-jihadists-wealth-power
Contreras, D. A., and Brodie, N. (2013). The utility of publicly-available satellite imagery for investigating looting of archaeological sites in Jordan. J. Field Archaeol. 35, 101–114. doi:10.1179/009346910X12707320296838
Coppin, P., Jonckheere, I., Nackaerts, K., Muys, B., and Lambin, E. (2004). Digital change detection methods in natural ecosystem monitoring: a review. Int. J. Remote Sens. 25, 1565–1596. doi:10.1080/0143116031000101675
Dai, X., and Khorram, S. (1998). The effects of image misregistration on the accuracy of remotely sensed change detection. IEEE Trans. Geosci. Remote Sensing 36, 1566–1577. doi:10.1109/36.718860
Dalal, N., and Triggs, B. (2005). “Histograms of oriented gradients for human detection,” in 2005 IEEE Computer Society Conference on Computer Vision and Pattern Recognition (CVPR’05), Vol. 1 (San Diego), 886–893.
Felch, J. (2014). Dante’s Inference. Available at: http://chasingaphrodite.com/2014/11/18/dantis-inference-the-known-unknowns-of-isis-and-antiquities-looting/
Gill, D. W. J. (2016). Context matters: the auction market and due diligence: the need for action. J. Art Crime 15, 73–77.
Hartigan, J. A., and Wong, M. A. (1979). Algorithm AS 136: a k-means clustering algorithm. J. R. Stat. Soc. Ser. C Appl. Stat. 28, 100–108.
Hofmann, P. (2001). “Detecting informal settlements from IKONOS image data using methods of object oriented image analysis-an example from Cape Town (South Africa),” in Remote Sensing of Urban Areas/Fernerkundung in urbanen Räumen, ed. C. Jürgens (Regensburg), 41–42. Available at: http://www.dsr.inpe.br/pagina_dsr_ingles/pessoal/hermann/RGS35_home.pdf
Hofmann, P., Strobl, J., Blaschke, T., and Kux, H. (2008). “Detecting informal settlements from QuickBird data in Rio de Janeiro using an object based approach,” in Object-Based Image Analysis, eds T. Blaschke, S. Lang, and G. J. Hay (Berlin & Heidelberg: Springer), 531–553.
Hritz, C. (2008). Remote sensing of cultural heritage in Iraq: a case study of Isin. TAARII Newslett. 3, 1–8.
Ikram, S. (2013). Cultural heritage in times of crisis: the view from Egypt. J. East. Mediterr. Archaeol. Heritage Stud. 1, 366–371. doi:10.5325/jeasmedarcherstu.1.4.0366
Ikram, S., and Hanna, M. (2013). Looting and land grabbing: the current situation in Egypt. Bull. Am. Res. Center Egypt 202, 34–39.
Ioannidis, C., Psaltis, C., and Potsiou, C. (2009). Towards a strategy for control of suburban informal buildings through automatic change detection. Comput. Environ. Urban Syst. 33, 64–74. doi:10.1016/j.compenvurbsys.2008.09.010
Kass, M., Witkin, A., and Terzopoulos, D. (1988). Snakes: active contour models. Int. J. Comput. Vis. 1, 321–331. doi:10.1007/BF00133570
Liu, R., Wang, Y., Baba, T., Masumoto, D., and Nagata, S. (2008). SVM-based active feedback in image retrieval using clustering and unlabeled data. Pattern Recognit. 41, 2645–2655. doi:10.1016/j.patcog.2008.01.023
Lowe, D. G. (2004). Distinctive image features from scale-invariant keypoints. Int. J. Comput. Vis. 60, 91–110. doi:10.1023/B:VISI.0000029664.99615.94
Lu, D., Mausel, P., Brondizio, E., and Moran, E. (2004). Change detection techniques. Int. J. Remote Sens. 25, 2365–2401. doi:10.1080/0143116031000139863
Mas, J.-F. (1999). Monitoring land-cover changes: a comparison of change detection techniques. Int. J. Remote Sens. 20, 139–152. doi:10.1080/014311699213659
Mayunga, S. D., Zhang, Y., and Coleman, D. J. (2005). “Semi-automatic building extraction utilizing Quickbird imagery,” in Proc. ISPRS Workshop CMRT, Vol. 13 (Vienna), 1–136.
Mountrakis, G., Im, J., and Ogole, C. (2011). Support vector machines in remote sensing: a review. ISPRS J. Photogramm. Remote Sensing 66, 247–259. doi:10.1016/j.isprsjprs.2010.11.001
Newson, P., and Young, R. (2015). The archaeology of conflict-damaged sites: Hosn Niha in the Biqa’ Valley, Lebanon. Antiquity 89, 449–463. doi:10.15184/aqy.2015.4
Opitz, D., and Blundell, S. (2008). “Object recognition and image segmentation: the Feature Analyst® approach,” in Object-Based Image Analysis, eds T. Blaschke, S. Lang, and G. J. Hay (Berlin & Heidelberg: Springer), 153–167.
Pal, M., and Mather, P. M. (2005). Support vector machines for classification in remote sensing. Int. J. Remote Sens. 26, 1007–1011. doi:10.1080/01431160512331314083
Parcak, S. (2007). Satellite remote sensing methods for monitoring archaeological tells in the Middle East. J. Field Archaeol. doi:10.1179/009346907791071773
Parcak, S., Gathings, D., Childs, C., Mumford, G., and Cline, E. (2016). Satellite evidence of archaeological site looting in Egypt: 2002–2013. Antiquity 90, 188–205. doi:10.15184/aqy.2016.1
Peng, J., Zhang, D., and Liu, Y. (2005). An improved snake model for building detection from urban aerial images. Pattern Recognit. Lett. 26, 587–595. doi:10.1016/j.patrec.2004.09.033
Pringle, H. (2014). “ISIS cashing in on looted antiquities to fuel Iraq insurgency,” in National Geographic, Vol. 27. Available at: http://news.nationalgeographic.com/news/2014/06/140626-isis-insurgents-syria-iraq-looting-antiquities-archaeology/
Proulx, B. B. (2013). Archaeological site looting in “glocal” perspective: nature, scope, and frequency. Am. J. Archaeol. 117, 111–125. doi:10.3764/aja.117.1.0111
Rekik, A., Zribi, M., Benjelloun, M., and ben Hamida, A. (2006). “A k-means clustering algorithm initialization for unsupervised statistical satellite image segmentation,” in 2006 1st IEEE International Conference on E-Learning in Industrial Electronics (Hammamet), 11–16.
Santosh, K. C., Wendling, L., Antani, S., and Thoma, G. R. (2016). Overlaid arrow detection for labeling regions of interest in biomedical images. IEEE Intell. Syst. 31, 66–75. doi:10.1109/MIS.2016.24
Singh, A. (1989). Review article digital change detection techniques using remotely-sensed data. Int. J. Remote Sens. 10, 989–1003. doi:10.1080/01431168908903939
Sirmacek, B., and Unsalan, C. (2009). Urban-area and building detection using SIFT keypoints and graph theory. IEEE Trans. Geosci. Remote Sensing 47, 1156–1167. doi:10.1109/TGRS.2008.2008440
Stone, E. C. (2008). Patterns of looting in southern Iraq. Antiquity 82, 125–138. doi:10.1017/S0003598X00096496
Tapete, D., Cigna, F., and Donoghue, D. N. (2016). ‘Looting marks’ in space-borne SAR imagery: measuring rates of archaeological looting in Apamea (Syria) with TerraSAR-X Staring Spotlight. Remote Sensing Environ. 178, 42–58. doi:10.1016/j.rse.2016.02.055
Thomas, D. C., Kidd, F. J., Nikolovski, S., and Zipfel, C. (2008). The archaeological sites of Afghanistan in google Earth. AARGnews 37, 22–30.
Volpi, M., Tuia, D., and Kanevski, M. (2012a). Memory-based cluster sampling for remote sensing image classification. IEEE Trans. Geosci. Remote Sensing 50, 3096–3106. doi:10.1109/TGRS.2011.2179661
Volpi, M., Tuia, D., Camps-Valls, G., and Kanevski, M. (2012b). Unsupervised change detection with kernels. IEEE Geosci. Remote Sensing Lett. 9, 1026–1030. doi:10.1109/LGRS.2012.2189092
Wei, Y., Zhao, Z., and Song, J. (2004). “Urban building extraction from high-resolution satellite panchromatic image using clustering and edge detection,” in Geoscience and Remote Sensing Symposium, 2004. IGARSS’04. Proceedings. 2004 IEEE International, Vol. 3 (Anchorage), 2008–2010.
Keywords: machine vision, archaeology, heritage, looting, automation, computational analysis, high resolution, Egypt
Citation: Bowen EFW, Tofel BB, Parcak S and Granger R (2017) Algorithmic Identification of Looted Archaeological Sites from Space. Front. ICT 4:4. doi: 10.3389/fict.2017.00004
Received: 08 December 2016; Accepted: 09 March 2017;
Published: 24 April 2017
Edited by:
Florence Forbes, Institut national de recherche en informatique et en automatique (INRIA), FranceReviewed by:
K. C. Santosh, University of South Dakota, USAPeter Savadjiev, Harvard Medical School, USA
Copyright: © 2017 Bowen, Tofel, Parcak and Granger. This is an open-access article distributed under the terms of the Creative Commons Attribution License (CC BY). The use, distribution or reproduction in other forums is permitted, provided the original author(s) or licensor are credited and that the original publication in this journal is cited, in accordance with accepted academic practice. No use, distribution or reproduction is permitted which does not comply with these terms.
*Correspondence: Richard Granger, richard.granger@dartmouth.edu