
California Property Reports
California Median Home Price Soars Past $400,000 Mark
Highest Since December 2007
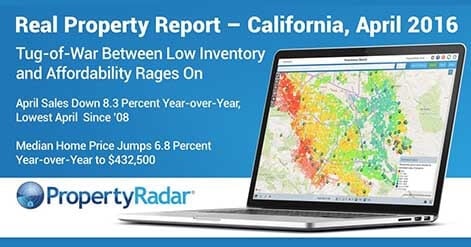
Home Sales Up 9.0 Percent from March
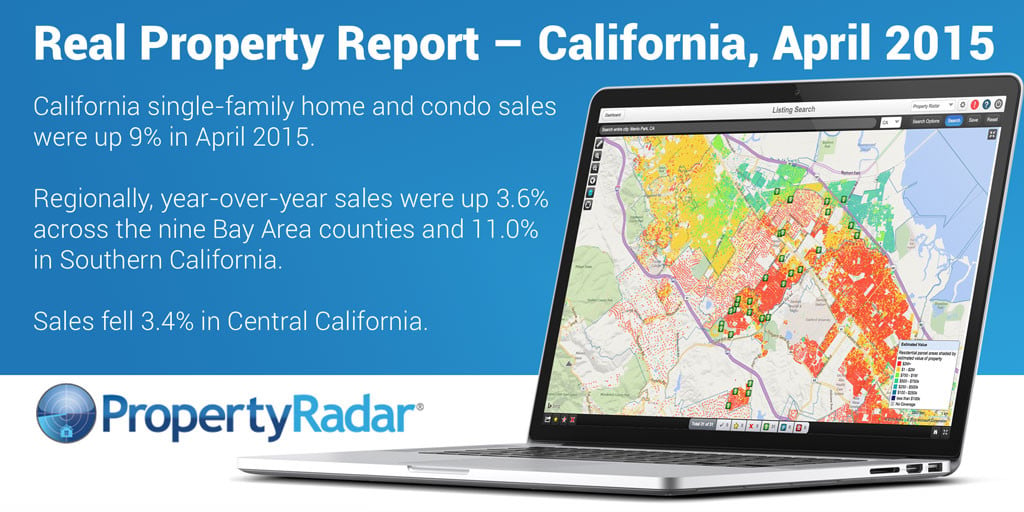
CALIFORNIA, MAY 19, 2015 -- California single-family home and condominium sales were up 9.0 percent in April 2015. April sales were 37,009 up from 33,946 in March. The increase in sales volume was predominantly due to the 9.2 percent gain in non-distressed property sales that accounted for 83.0 percent of total sales.
On a year-over-year basis, sales volumes were up 5.8 percent from 34,995 in April 2014 to 37,009 in April 2015. Regionally, year-over-year sales were up 3.6 percent across the nine Bay Area counties and 11.0 percent in Southern California. Sales fell 3.4 percent in Central California.
“For the second consecutive month, California property sales were higher than a year earlier,” said Madeline Schnapp, Director of Economic Research for PropertyRadar. “Year-over-year growth in sales ground to a halt in September 2013. While it is still too early in the year to say the California real estate market is off to the races, healthy job growth in the past 18 months combined with pent-up seasonal demand certainly worked to drive sales higher during the past two months.”
The median price of a California home was $405,000 in April, a gain of $12,000, or 3.1 percent from $393,000 in March. For the month, median prices rose in 19 of California’s largest 26 counties. The counties that saw the biggest median price increases were Contra Costa (+5.15 percent), Santa Cruz (+6.72 percent), and San Francisco (+11.1 percent).
On a year-over-year basis, the median price of a California home was up 8.0 percent from $375,000 in April 2014. Four of California’s largest counties experienced double-digit year-over-year price increases. Those counties were San Francisco (+23.6 percent), San Luis Obispo (+15.7 percent), San Mateo (+15.0 percent), and Santa Cruz (+14.6 percent).
“For the second consecutive month, the median price of a California home was significantly higher,” said Schnapp. “Despite high prices, buyers are still stepping up to the plate to purchase homes. With the Federal Reserve on tap to raise short-term interest rates as early as September, potential homebuyers may be worried that the current environment of near record low interest rates may not last.”
Cash sales were 21.1 percent of total sales in April, down from 25.2 percent a year earlier.
“Despite the fact that nearly one-in-five sales are cash sales, the lack of lower-priced inventory is sending an increasing number of cash buyers to the sidelines,” said Schnapp. Cash purchases will likely continue to decrease in the face of rapidly rising prices.”
Foreclosure Starts, Notices of Default (NODs), were up 2.5 percent from March but were down 7.3 percent in the past 12 months. Foreclosure Sales jumped 19.2 percent for the month and were up 27.7 percent from the February 2015 low.
“The rise in Foreclosure Sales may be a sign that financial institutions are pushing to liquidate their foreclosure inventory in order to take advantage of high prices,” said Schnapp.
In other California housing news:
- Cash sales totaled 7,794 in April, down 3.8 percent from March, and represented 21.1 percent of total sales. Cash sales as a percentage of total sales have been steadily declining since reaching a peak of 40.0 percent of total sales in August 2011. Since then, cash sales are down 45.0 percent. Cash sales were highest in Santa Cruz, Santa Barbara, Tulare, Riverside, and Marin counties.
- Flip sales totaled 1,081 in April, down 2.2 percent for the month and 22.7 percent for the year. Flip sales are defined as properties that have been resold within six months. Flip sales comprised 3.3 percent of total sales in April, down 0.2 percent from 3.5 percent of sales in March. Flip sales peaked in July 2013 at 4.7 percent of total sales and have declined 44.4 percent since then.
- April Institutional Investor LLC and LP purchases totaled 1,263, up 1.0 percent for the month but down 0.7 percent from April 2014. Over the longer term, institutional investor demand has retreated due to the lower return on investment and dwindling supply of distressed properties for sale. Institutional purchases were down 43.1 percent since peaking in December 2012. Similarly, Trustee Sale purchases by LLC and LPs were down 81.1 percent from their October 2012 peak.
“In the tug-of-war between high prices on the one side and pent-up demand and low interest rates on the other, the latter appears to have the edge,” said Schnapp.
“We shouldn’t get too excited about the sales pop in March-April which are typically elevated, but if current trends continue we might start to hear the word “bubble” bandied about the water cooler. And speaking of water, with sales falling 3.4 percent in Central California, we are certainly keeping an eye out for any market affects related to the California drought.”
Home Sales
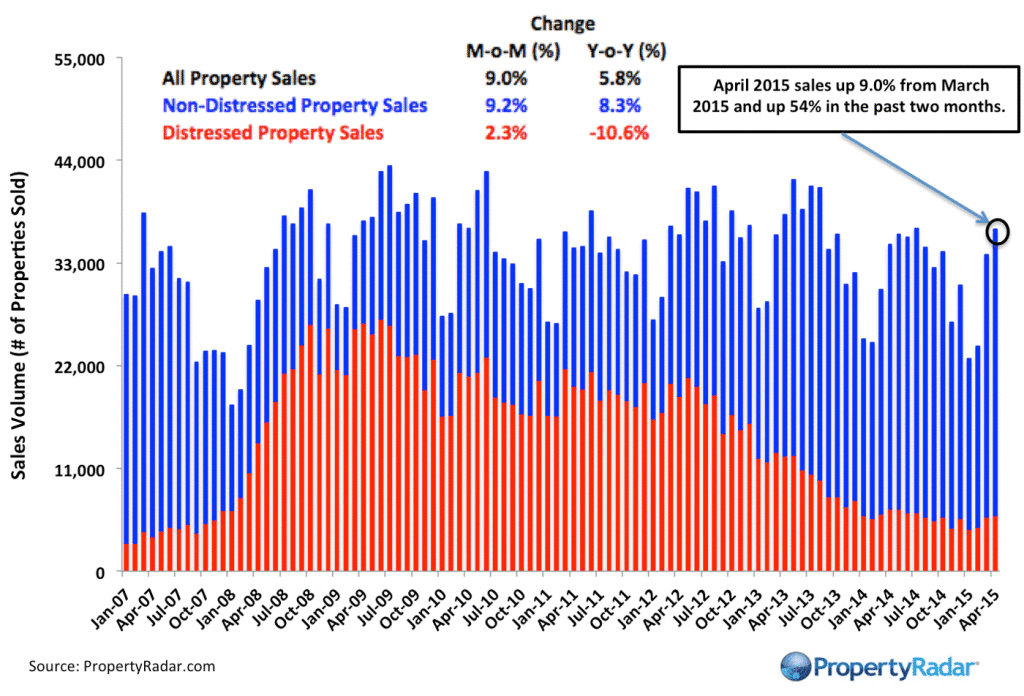
Home Sales - Single-family residence and condominium sales by month from 2007 to current divided into distressed and non-distressed sales. Distressed sales are the sum of short sales, where the home is sold for less than the amount owed, and REO sales, where banks resell homes that they took ownership of after foreclosure. All other sales are considered non-distressed.
Year-over-Year Home Sales
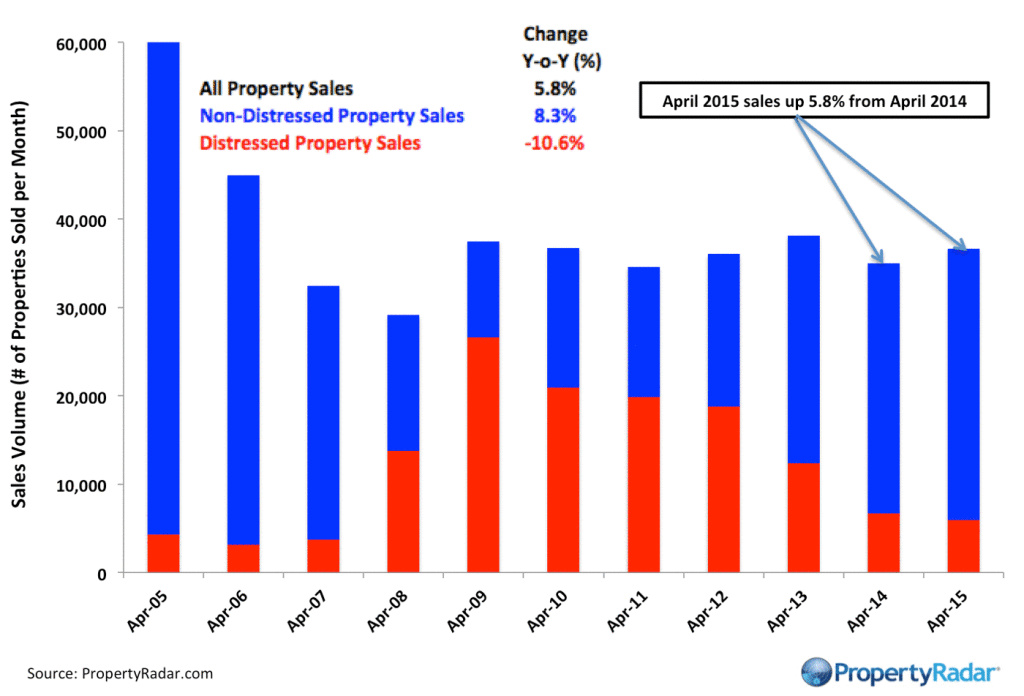
Year-over-Year Home Sales Year-over-Year Home Sales - Single-family residences and condominiums sold during the same month for the current year and prior years divided into distressed and non-distressed sales.
Median Sales Prices vs. Sales Volume
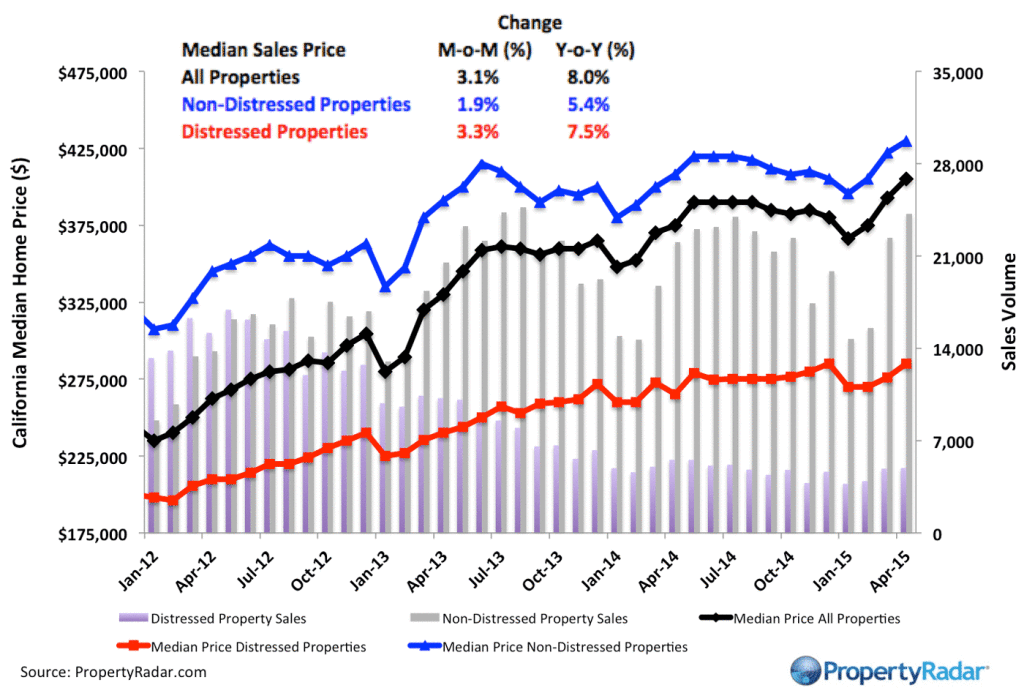
Median Sales Price vs. Sales Volume - Median sales price (left axis) of a California single family home versus sales volume (right axis), by month from 2012 to current. Median sales prices are divided into three categories: All single-family homes (black line), distressed properties (red line), and non-distressed properties (blue line). Monthly sales volumes (right axis) are illustrated as gray and lavender bars. The gray bars are distressed sales and the lavender bars are non-distressed sales.
California Homeowner Equity
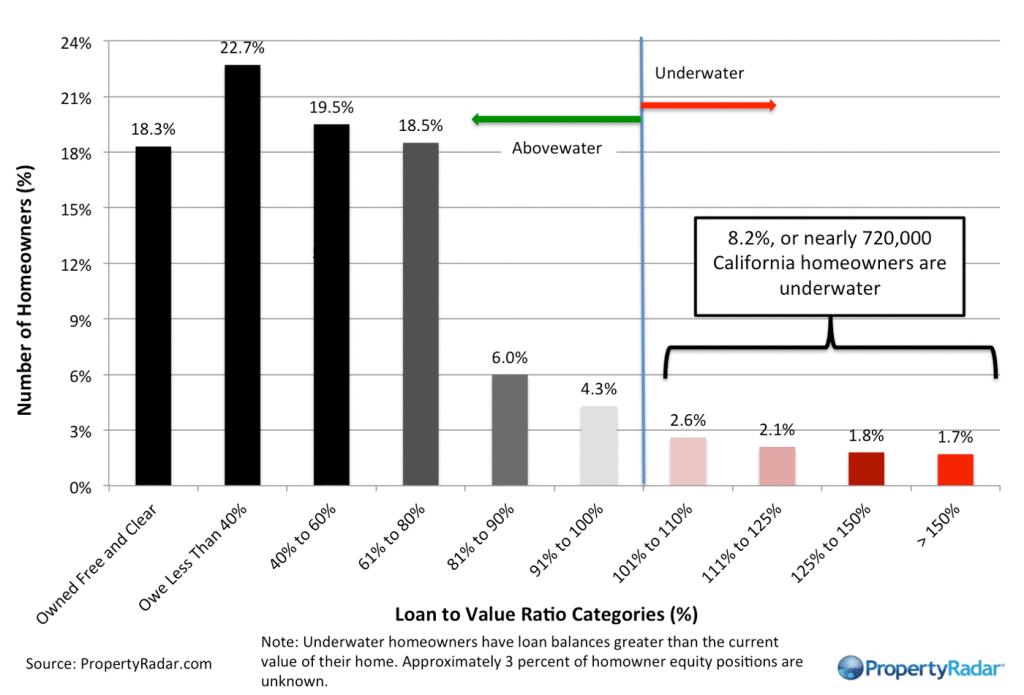
California Home Owner Equity - A model estimate of California homeowners segregated into various categories of levels of homeowner equity for a given month. Homeowner numbers represent a percentage of total California homeowners.
Cash Sales
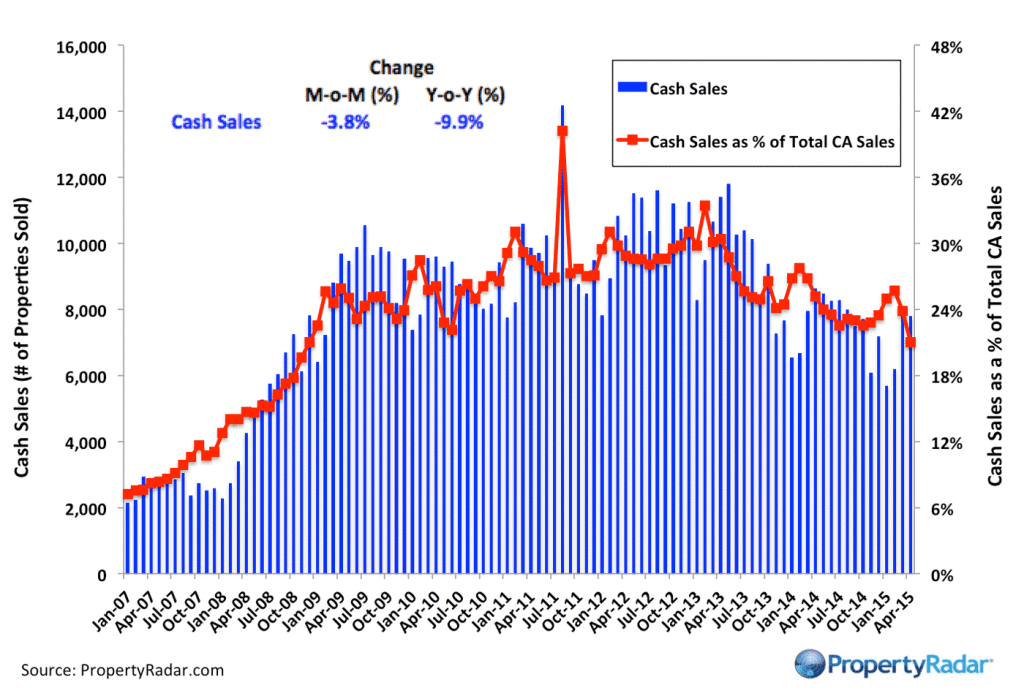
Cash Sales - The blue bars (right axis) illustrate cash sales of single-family residences and condominiums by month. The red line (left axis) illustrates cash sales as a percentage of total sales by month.
Flipping
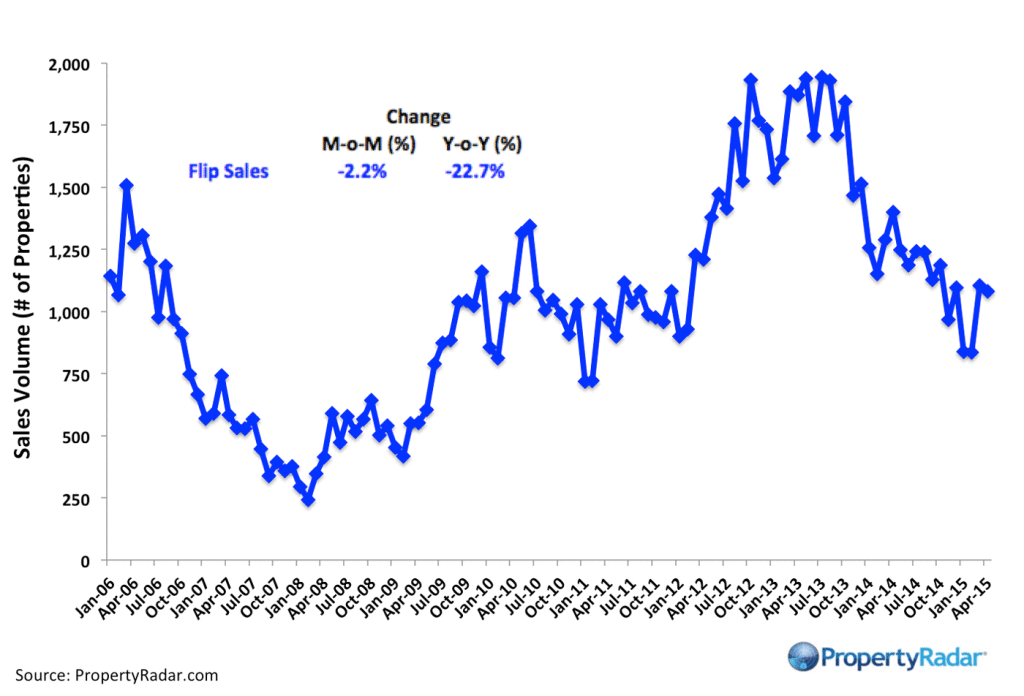
Flipping – The number of single-family residences and condominiums resold within six months.
Market Purchases by LLCs and LPs
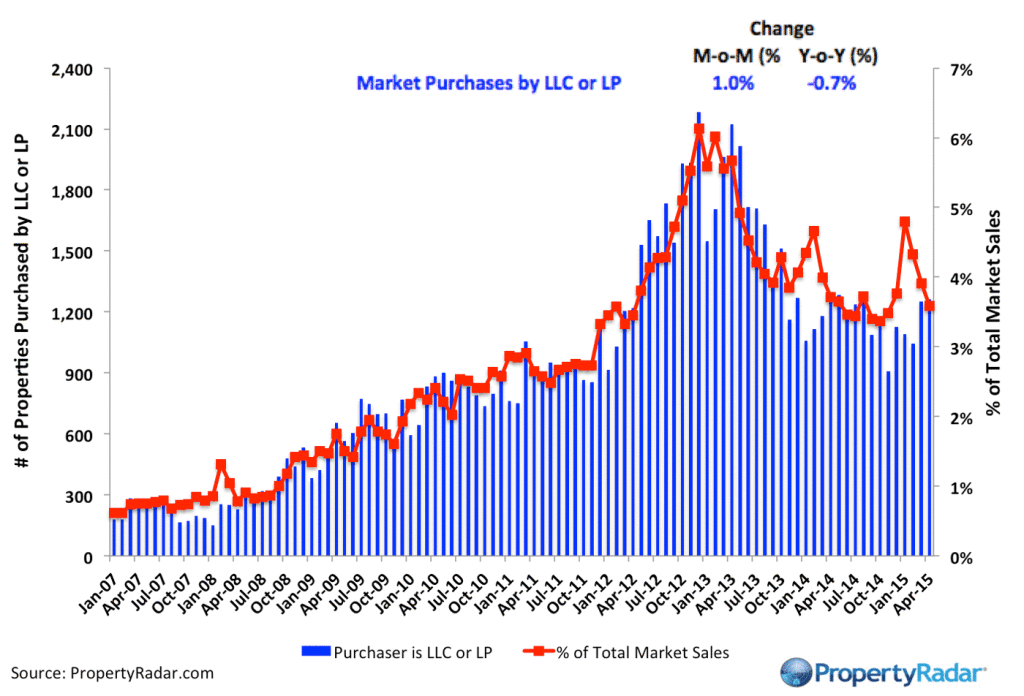
Market Purchases by LLCs and LPs - The blue bars (right axis) illustrate market purchases of single-family residences and condominiums by LLCs and LPs from 2007 to current. The red line graph (left axis) illustrates LLC and LP purchases as a percentage of total sales by month.
Market Sales by LLCs and LPs
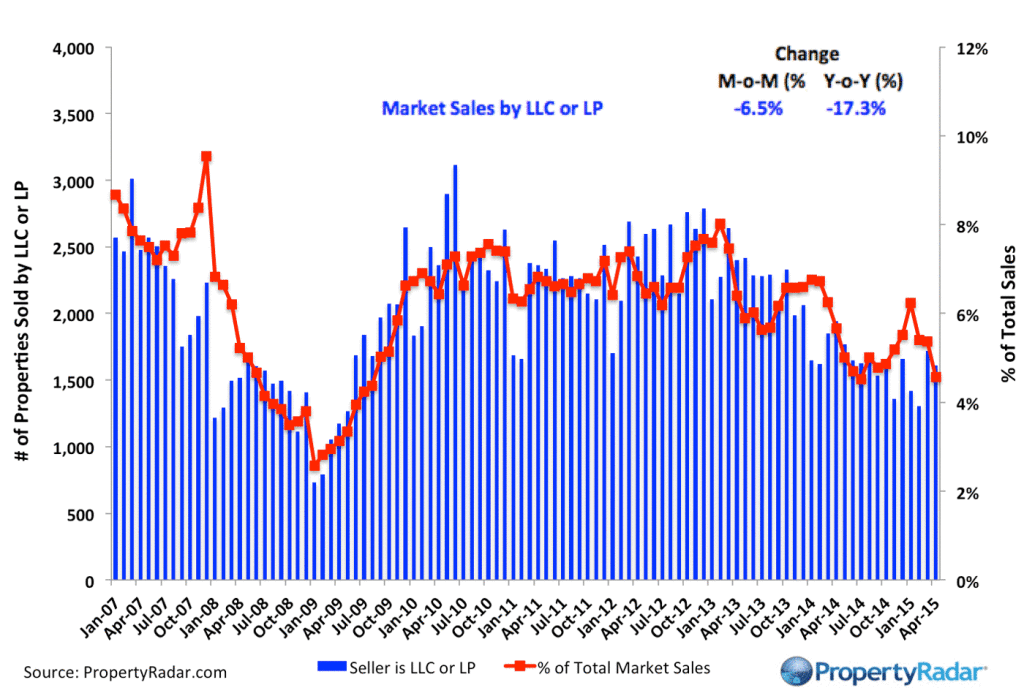
Market Sales by LLCs and LPs - The blue bars (right axis) illustrate market sales by LLCs and LPs of single-family residences and condominiums by month. The red line graph (left axis) illustrates sales as a percentage of total sales by month.
Trustee Sale Purchases by LLCs and LPs
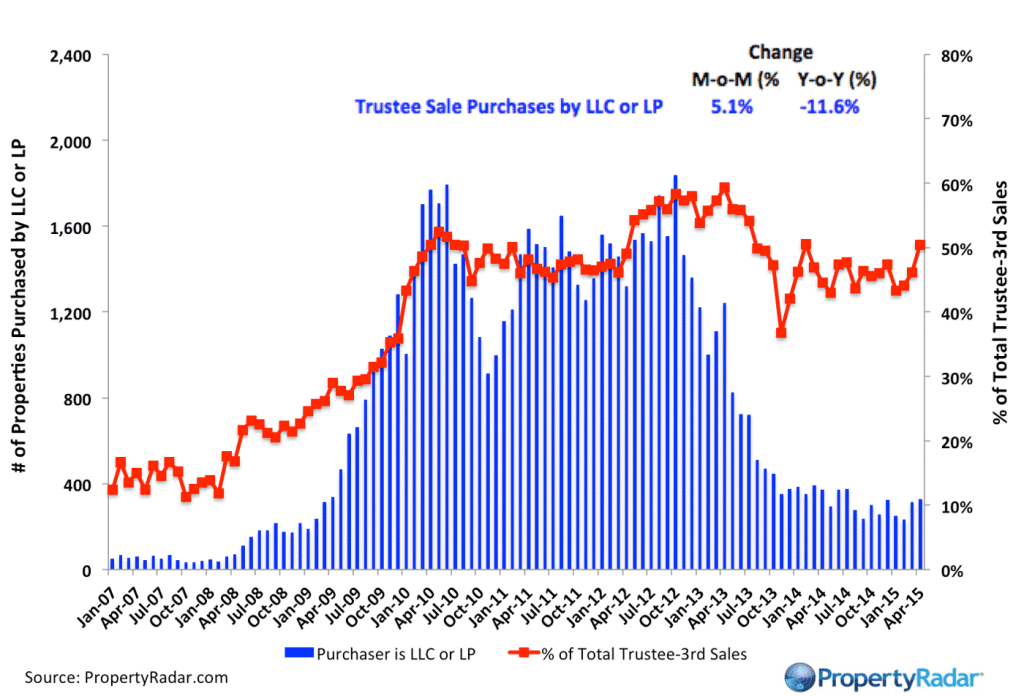
Trustee Sale Purchases by LLCs and LPs - The blue bars (right axis) illustrate trustee sale purchases (foreclosure sales) of single-family residences and condominiums by LLCs and LPs from 2007 to current. The red line graph (left axis) illustrates purchases as a percentage of total trustee sales by month.
Foreclosure Notices and Sales
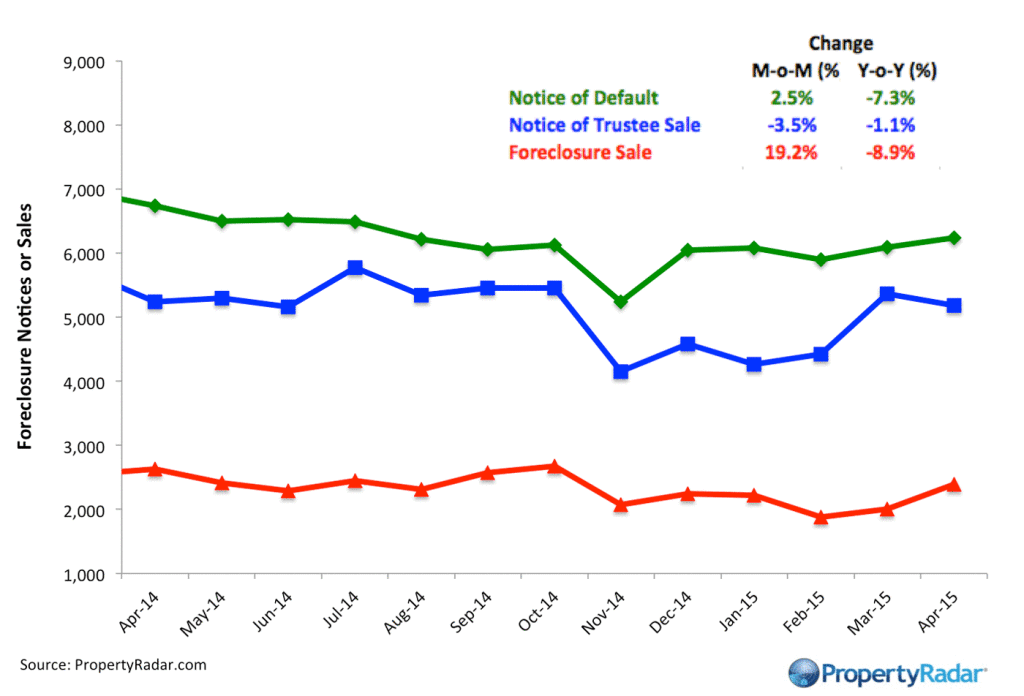
Foreclosure Notices and Sales - Properties that have received foreclosure notices — Notice of Default (green) or Notice of Trustee Sale (blue) — or have been sold at a foreclosure auction (red) by month.
Foreclosure Inventories
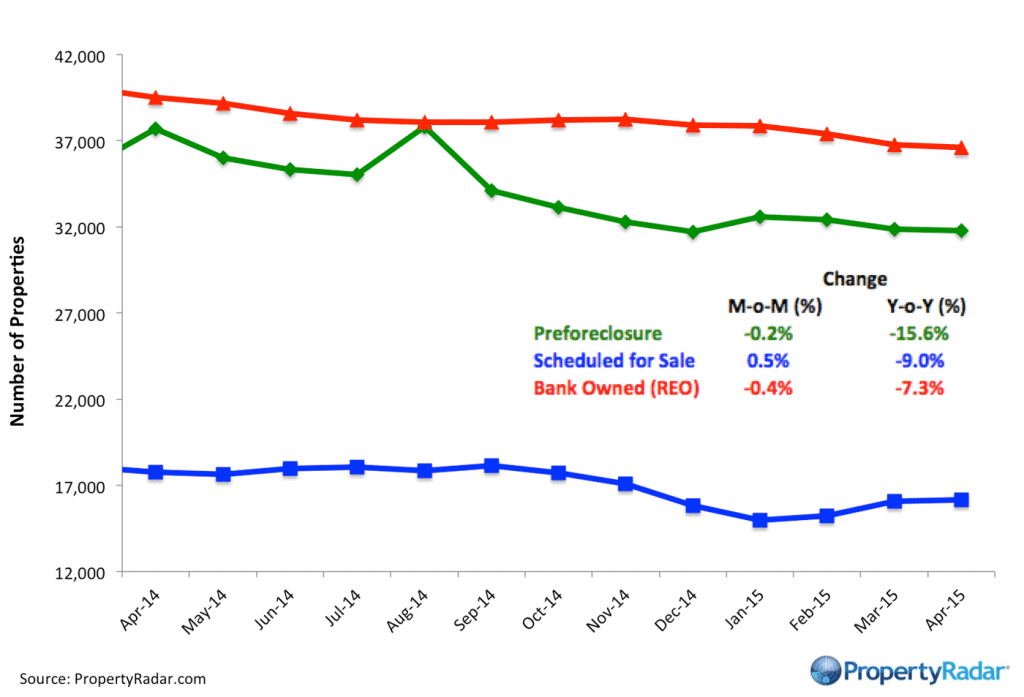
Foreclosure Inventory - Preforeclosure inventory estimates the number of properties that have had a Notice of Default filed against them but have not been Scheduled for Sale, by month. Scheduled for Sale inventory represents properties that have had a Notice of Trustee Sale filed but have not yet been sold or had the sale cancelled, by month. Bank-Owned (REO) inventory means properties sold Back to the Bank at the trustee sale and the bank has not resold to another party, by month.
Real Property Report Methodology
California real estate data presented by PropertyRadar, including analysis, charts and graphs, is based upon public county records and daily trustee sale (foreclosure auction) results. Items are reported as of the date the event occurred or was recorded with the California County. If a county has not reported complete data by the publication date, we may estimate the missing data, though only if the missing data is believed to be 10 percent or less.