Energy
Explaining the Surging Demand for Lithium-Ion Batteries
The Battery Series
Part 3: Explaining the Surging Demand for Lithium-Ion Batteries
The Battery Series is a five-part infographic series that explores what investors need to know about modern battery technology, including raw material supply, demand, and future applications.
Presented by: Nevada Energy Metals, eCobalt Solutions Inc., and Great Lakes Graphite


Explaining the Surging Demand for Lithium-Ion Batteries
In Parts 1 and 2, we examined the evolution of battery technology as well as what batteries can and cannot do. In this part, we will tackle demand in the rechargeable battery market, with a major focus on the rapidly growing lithium-ion segment.
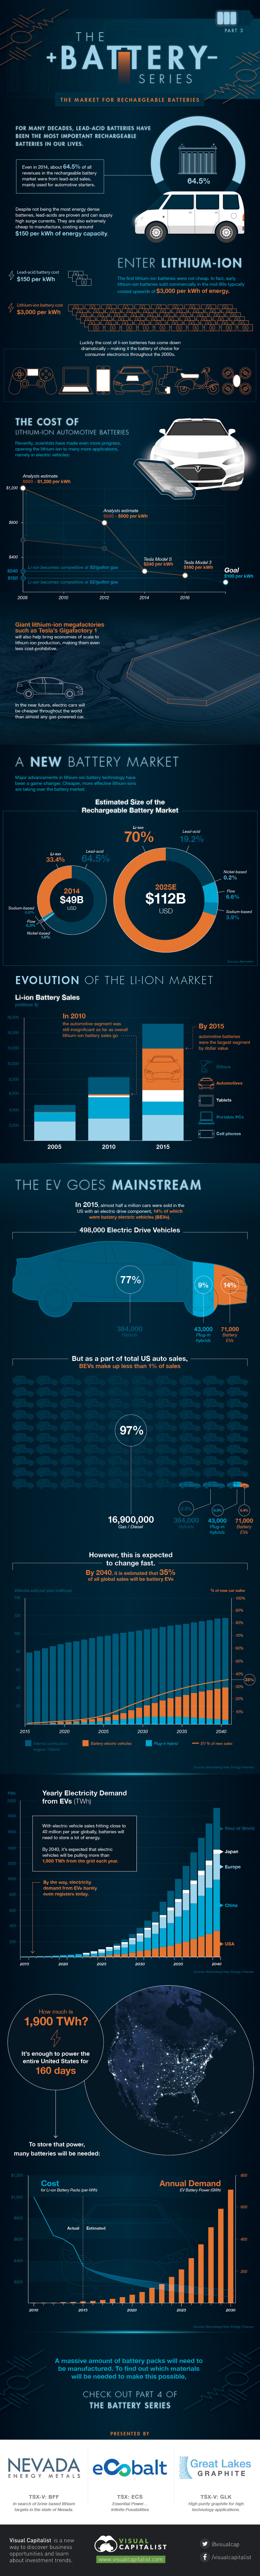
For many decades, lead-acid batteries have been the most important rechargeable batteries in our lives.
Even in 2014, about 64.5% of all revenues in the rechargeable battery market were from lead-acid sales, mainly to be used for automotive starters.


Why?
Despite not being the most energy dense batteries, lead-acids are proven and can supply high surge currents. They are also extremely cheap to manufacture, costing around $150 per kWh of energy capacity.
Enter Lithium-Ion
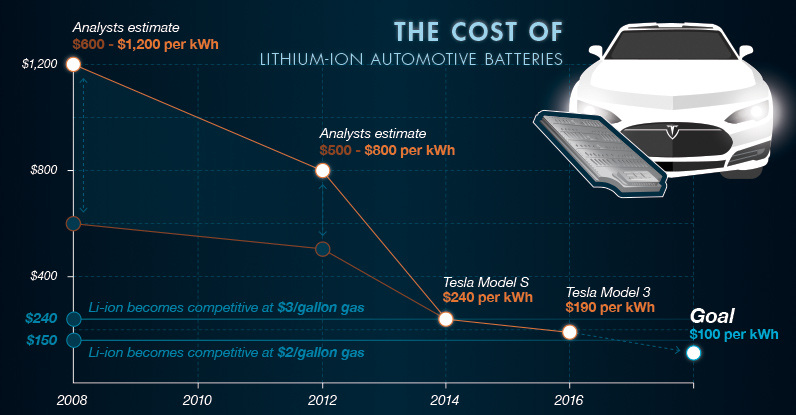
The first lithium-ions were not cheap. In fact, early batteries produced commercially in the mid-90s typically costed upwards of $3,000 per kWh of energy.
Luckily, the cost of lithium-ion batteries has come down dramatically, making it the battery of choice for consumer electronics throughout the 2000s. And recently, scientists have made even more progress, opening the lithium-ion to many more applications, namely in electric vehicles.
In 2008, analysts estimated that lithium-ion battery packs costed $600-$1,200 per kWh, but this range would drop to $500-800 per kWh over the following four years. Tesla now claims that a Tesla Model S battery cost is $240 per kWh and that the expected cost for a Model 3 is $190 per kWh.
At $240 kWh, lithium-ions become competitive with $3/gallon gas. At $150, they are even competitive with $2 gas.
Giant megafactories such as Tesla’s Gigafactory 1 will also help bring economies of scale to lithium-ion production, making them even less cost-prohibitive. Soon battery packs will cost closer to $100 per kWh, which will make them essentially cheaper than all gas-powered vehicles.
Demand for Lithium-Ion Batteries
Major advancements in lithium-ion battery technology have been a game-changer. Cheaper, more-effective lithium-ions are now taking over the battery market.
In 2014, lithium-ions made up 33.4% of the rechargeable battery market worldwide, worth $49 billion. By 2025, it is estimated by Bernstein that the rechargeable battery market will more than double in size to $112 billion, while lithium-ion’s market share will more than double to 70.0%.
The key driver? The automotive segment.
In 2010, the automotive sector was a drop in the bucket for lithium-ion battery sales. Five years later, automotive made up more than $5 billion of sales in a sector worth nearly $16 billion.
The EV Goes Mainstream
In 2015, almost half a million cars were sold in the US with an electric drive component.
14% of these sales were battery electric vehicles (BEVs):
- 71,000 Battery EVs (14%)
- 43,000 plug-in hybrids (9%)
- 384,000 hybrids (77%)
= 498,000 electric drive vehicles
But as a part of total US auto sales, BEVs still made up less than 1% of sales:
- 71,000 battery EVs (0.4%)
- 43,000 plug-in hybrids (0.3%)
- 384,000 hybrids (2.3%)
- 16,900,000 gas/diesel sales (97%)
However, in the near future, this is expected to change fast. By 2040, approximately 35% of all global sales will be BEVs.
This will put electric vehicle sales at close to 40 million per year globally, meaning a lot of energy will need to be stored by batteries. Bloomberg New Energy Finance expects that at this point, that electric vehicles will be pulling more than 1,900 TWh from the grid each year.
How much is 1,900 TWh? It’s enough to power the entire United States for 160 days.
And to meet this demand for lithium-ion powered vehicles, a massive amount of battery packs will need to be manufactured.
Part 4 of The Battery Series looks at which materials will be needed to make this possible.


Energy
The World’s Biggest Nuclear Energy Producers
China has grown its nuclear capacity over the last decade, now ranking second on the list of top nuclear energy producers.


The World’s Biggest Nuclear Energy Producers
This was originally posted on our Voronoi app. Download the app for free on Apple or Android and discover incredible data-driven charts from a variety of trusted sources.
Scientists in South Korea recently broke a record in a nuclear fusion experiment. For 48 seconds, they sustained a temperature seven times that of the sun’s core.
But generating commercially viable energy from nuclear fusion still remains more science fiction than reality. Meanwhile, its more reliable sibling, nuclear fission, has been powering our world for many decades.
In this graphic, we visualized the top producers of nuclear energy by their share of the global total, measured in terawatt hours (TWh). Data for this was sourced from the Nuclear Energy Institute, last updated in August 2022.
Which Country Generates the Most Nuclear Energy?
Nuclear energy production in the U.S. is more than twice the amount produced by China (ranked second) and France (ranked third) put together. In total, the U.S. accounts for nearly 30% of global nuclear energy output.
However, nuclear power only accounts for one-fifth of America’s electricity supply. This is in contrast to France, which generates 60% of its electricity from nuclear plants.
| Rank | Country | Nuclear Energy Produced (TWh) | % of Total |
|---|---|---|---|
| 1 | 🇺🇸 U.S. | 772 | 29% |
| 2 | 🇨🇳 China | 383 | 14% |
| 3 | 🇫🇷 France | 363 | 14% |
| 4 | 🇷🇺 Russia | 208 | 8% |
| 5 | 🇰🇷 South Korea | 150 | 6% |
| 6 | 🇨🇦 Canada | 87 | 3% |
| 7 | 🇺🇦 Ukraine | 81 | 3% |
| 8 | 🇩🇪 Germany | 65 | 2% |
| 9 | 🇯🇵 Japan | 61 | 2% |
| 10 | 🇪🇸 Spain | 54 | 2% |
| 11 | 🇸🇪 Sweden | 51 | 2% |
| 12 | 🇧🇪 Belgium | 48 | 2% |
| 13 | 🇬🇧 UK | 42 | 2% |
| 14 | 🇮🇳 India | 40 | 2% |
| 15 | 🇨🇿 Czech Republic | 29 | 1% |
| N/A | 🌐 Other | 219 | 8% |
| N/A | 🌍 Total | 2,653 | 100% |
Another highlight is how China has rapidly grown its nuclear energy capabilities in the last decade. Between 2016 and 2021, for example, it increased its share of global nuclear energy output from less than 10% to more than 14%, overtaking France for second place.
On the opposite end, the UK’s share has slipped to 2% over the same time period.
Meanwhile, Ukraine has heavily relied on nuclear energy to power its grid. In March 2022, it lost access to its key Zaporizhzhia Nuclear Power Station after Russian forces wrested control of the facility. With six 1,000 MW reactors, the plant is one of the largest in Europe. It is currently not producing any power, and has been the site of recent drone attacks.

-

 Mining2 weeks ago
Charted: The Value Gap Between the Gold Price and Gold Miners
-

 Real Estate1 week ago
Ranked: The Most Valuable Housing Markets in America
-

 Business1 week ago
Charted: Big Four Market Share by S&P 500 Audits
-

 AI1 week ago
The Stock Performance of U.S. Chipmakers So Far in 2024
-

 Misc1 week ago
Almost Every EV Stock is Down After Q1 2024
-

 Money2 weeks ago
Where Does One U.S. Tax Dollar Go?
-

 Green2 weeks ago
Ranked: Top Countries by Total Forest Loss Since 2001
-

 Markets2 weeks ago
Visualizing America’s Shortage of Affordable Homes