

Systematic relationships of five newly sequenced cervid species
- Published
- Accepted
- Received
- Academic Editor
- Sean Rogers
- Subject Areas
- Biodiversity, Computational Biology, Evolutionary Studies, Taxonomy, Zoology
- Keywords
- Cervidae, Phylogeny, Polyphyly, Cytochrome b, Pudu, Mazama, Muntiacus, Rusa
- Copyright
- © 2016 Heckeberg et al.
- Licence
- This is an open access article distributed under the terms of the Creative Commons Attribution License, which permits unrestricted use, distribution, reproduction and adaptation in any medium and for any purpose provided that it is properly attributed. For attribution, the original author(s), title, publication source (PeerJ) and either DOI or URL of the article must be cited.
- Cite this article
- 2016. Systematic relationships of five newly sequenced cervid species. PeerJ 4:e2307 https://doi.org/10.7717/peerj.2307
Abstract
Cervid phylogenetics has been puzzling researchers for over 150 years. In recent decades, molecular systematics has provided new input for both the support and revision of the previous results from comparative anatomy but has led to only partial consensus. Despite all of the efforts to reach taxon-wide species sampling over the last two decades, a number of cervid species still lack molecular data because they are difficult to access in the wild. By extracting ancient DNA from museum specimens, in this study, we obtained partial mitochondrial cytochrome b gene sequences for Mazama bricenii, Mazama chunyi, Muntiacus atherodes, Pudu mephistophiles, and Rusa marianna, including three holotypes. These new sequences were used to enrich the existing mitochondrial DNA alignments and yielded the most taxonomically complete data set for cervids to date. Phylogenetic analyses provide new insights into the evolutionary history of these five species. However, systematic uncertainties within Muntiacus persist and resolving phylogenetic relationships within Pudu and Mazama remain challenging.
Introduction
Cervidae forms a subclade of ruminant artiodactyls and is the second most diverse group among terrestrial artiodactyls, with 55 extant species (IUCN, 2015), including one recently extinct species (Rucervus schomburgki; Duckworth, Robichaud & Timmins, 2008). Cervids natively inhabit Eurasia, the Americas, and potentially northernmost Africa (Mattioli, 2011). They are adapted to diverse climatic zones, ranging from the tropics to arctic regions, and to diverse habitats such as tundra, grasslands, swamps, forests, woodlands, and ecotones (Mattioli, 2011). Their unique phenotypic feature is a pair of antlers, which are osseous outgrowths of the frontal bone that are shed and rebuilt regularly. The current conservation status of cervids lists 29 species as ‘threatened’, nine species as ‘data deficient’, and 17 species as ‘least concern’ in the IUCN Red List of Threatened Species (IUCN, 2015). Samples and life history data are much more difficult to obtain from rare and threatened species than from more abundant species. Therefore, there is a discrepancy between the well-studied (e.g., Cervus elaphus, red deer; Odocoileus hemionus, mule deer; Rangifer tarandus, reindeer) and barely known species (e.g., Mazama spp., brocket deer; Pudu spp., pudu; Muntiacus spp., muntjac). Consequently, data for the latter taxa are overdue.
Cervid phylogenetics has improved considerably in recent decades through molecular systematics (e.g., Hassanin & Douzery, 2003; Pitra et al., 2004; Kuznetsova, Kholodova & Danilkin, 2005; Hernández-Fernández & Vrba, 2005; Hughes et al., 2006; Gilbert, Ropiquet & Hassanin, 2006; Marcot, 2007; Agnarsson & May-Collado, 2008; Duarte, González & Maldonado, 2008; Hassanin et al., 2012). However, several species are still underrepresented in molecular phylogenetic analyses because their current conservation status of threatened or data deficient negatively affects their sample collection.
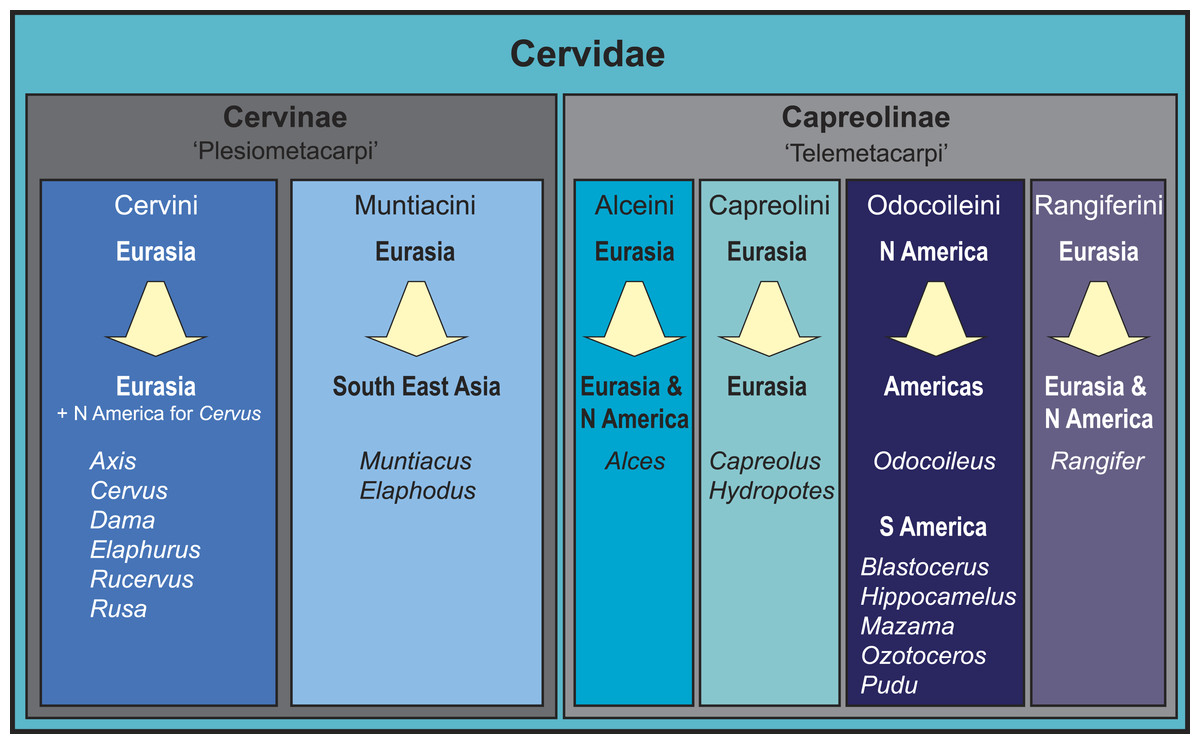
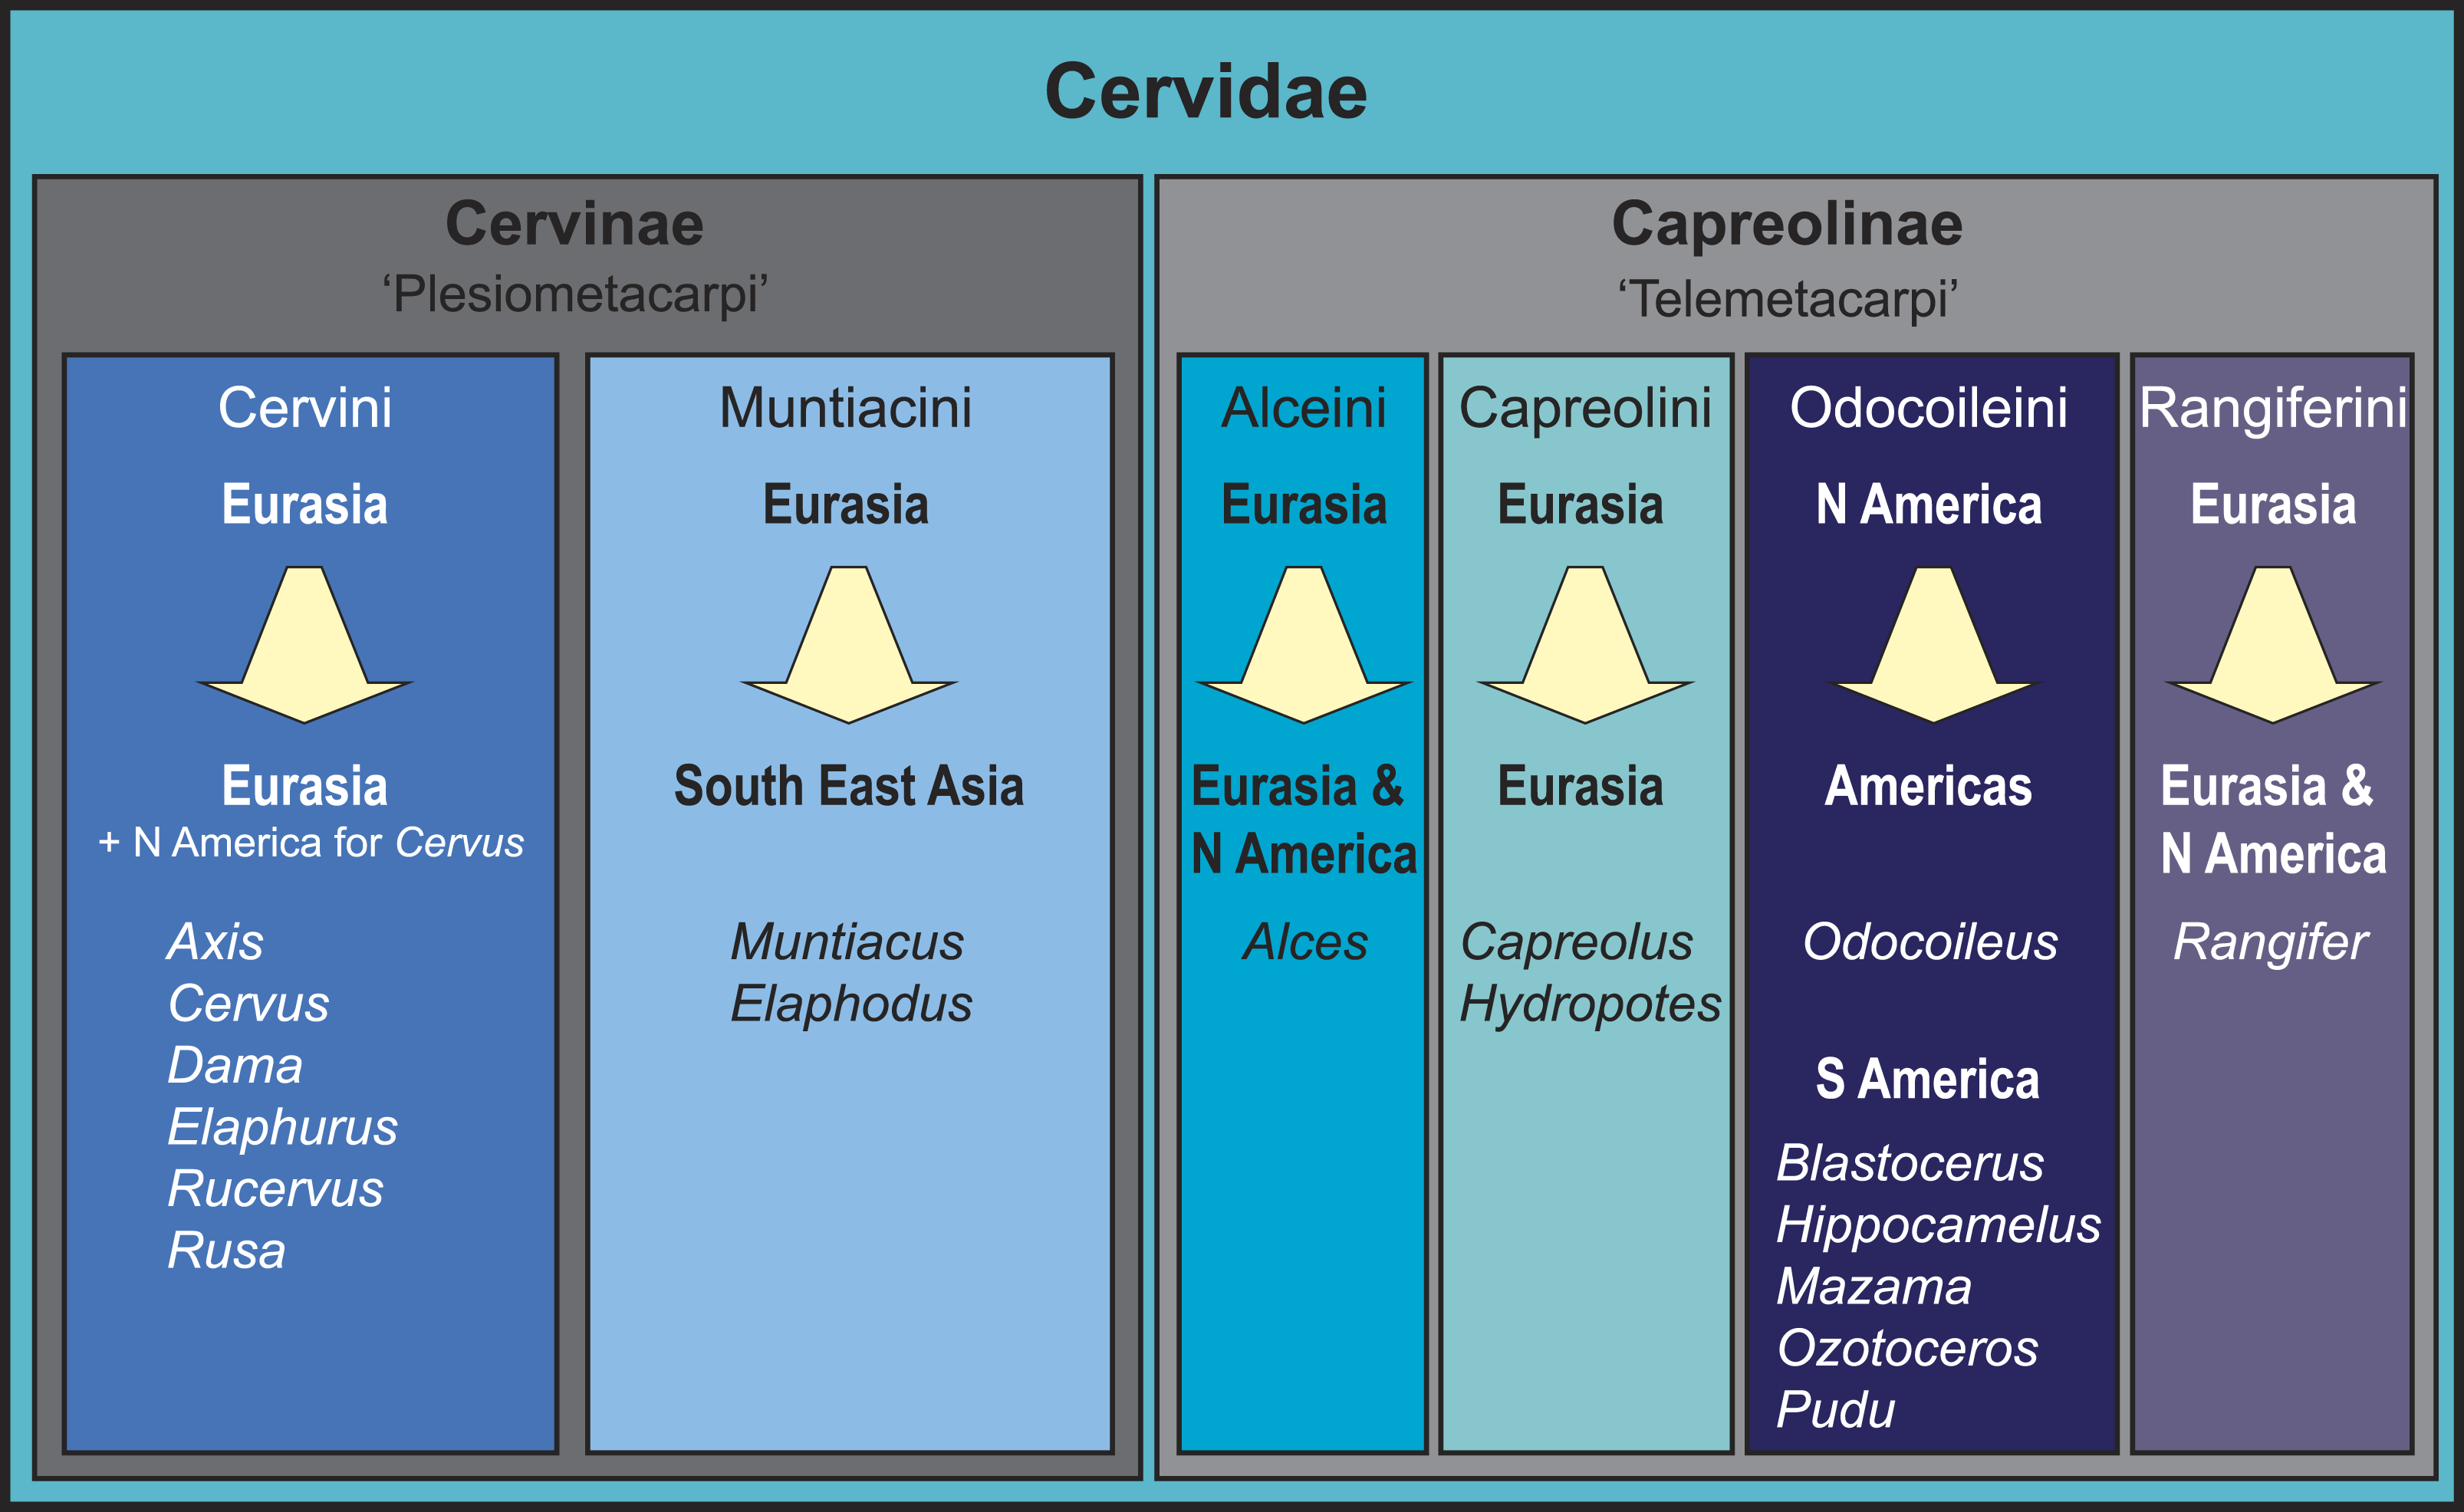
Figure 1: Overview of the current state of the art of cervid classification based on literature (e.g., Hassanin & Douzery, 2003; Pitra et al., 2004; Kuznetsova, Kholodova & Danilkin, 2005; Hernández-Fernández & Vrba, 2005; Hughes et al., 2006; Gilbert, Ropiquet & Hassanin, 2006; Marcot, 2007; Agnarsson & May-Collado, 2008; Duarte, González & Maldonado, 2008; Hassanin et al., 2012).
The diagram shows the different clades, their geographical origination, and their current distribution.Consensus has been reached for the monophyly of taxa Cervidae, Muntiacini, Cervini, Capreolini and Odocoileini. Muntiacini and Cervini form the clade Cervinae, which is a sister taxon to Capreolinae comprising Odocoileini, Rangiferini, Capreolini and Alceini (e.g., Hernández-Fernández & Vrba, 2005; Gilbert, Ropiquet & Hassanin, 2006; Hassanin et al., 2012). The Capreolinae-Cervinae-split is commonly supported in previously published topologies and corresponds to the first (though not formally valid) morphological cervid classification by Brooke (1878), who differentiated Plesiometacarpi and Telemetacarpi (Fig. 1). Systematic relationships within Cervinae appear to be largely resolved, whereas Capreolinae systematics is more controversial (Pitra et al., 2004; Gilbert, Ropiquet & Hassanin, 2006; Duarte, González & Maldonado, 2008; Hassanin et al., 2012; Croitor, 2014). For an overview of current cervid classifications, see Fig. 1.
The mitochondrial cytochrome b (Cytb) gene is the best-sampled across cervids. Cytb is a marker that is known to be highly variable in mammals, which makes it a suitable marker for resolving genus and species level relationships but less suitable for resolving deeper nodes (family level and above) or for population studies (Hofreiter et al., 2001a). In addition, because mitochondrial genomes are maternally inherited, they may not allow a full reconstruction of a species’ evolutionary history if there is no random mating.
However, Hassanin et al. (2012) sequenced and analysed mitochondrial genomes of 33 cervid species as part of a large Artiodactyla phylogenetic reconstruction and provided a robust phylogenetic framework for cervids. To date, sampling of mitochondrial genomes and individual partial Cytb sequences cover 46 of the 55 cervid species.
Here, we present the results of phylogenetic analyses that include four species not previously sampled for molecular data: Mazama chunyi (Peruvian dwarf brocket), Muntiacus atherodes (Bornean yellow muntjac; including holotype), Pudu mephistophiles (Northern pudu; including holotype), and Rusa marianna (Philippine brown deer), all of which were taken from museum specimens. We also sequenced three Mazama bricenii museum specimens (Mérida brocket; including the holotype), of which Cytb sequences have been published recently and were sequenced contemporaneously with our study (Gutiérrez et al., 2015). Except for M. atherodes (least concern), all species have been assessed as vulnerable based on the IUCN Red List. Therefore, considering the threat of extinction, our approach of sequencing DNA from museum material is an important contribution to cervid systematics.
The specific aims of our study were (1) to reconstruct the systematic position of M. bricenii and M. chunyi and further investigate the polyphyly of the genus Mazama, (2) to reconstruct the systematic position of M. atherodes, (3) to test the monophyly of the Philippine Rusa species (R. alfredi and R. marianna) and their sister taxon position relative to the Indonesian and mainland Rusa species (R. timorensis and R. unicolor), and (4) to test the monophyly of Pudu.
To achieve these aims, we experimented with different matrix sizes and parameters to examine the reliability of the phylogenetic signal throughout different data sets.
Material & Methods
Material
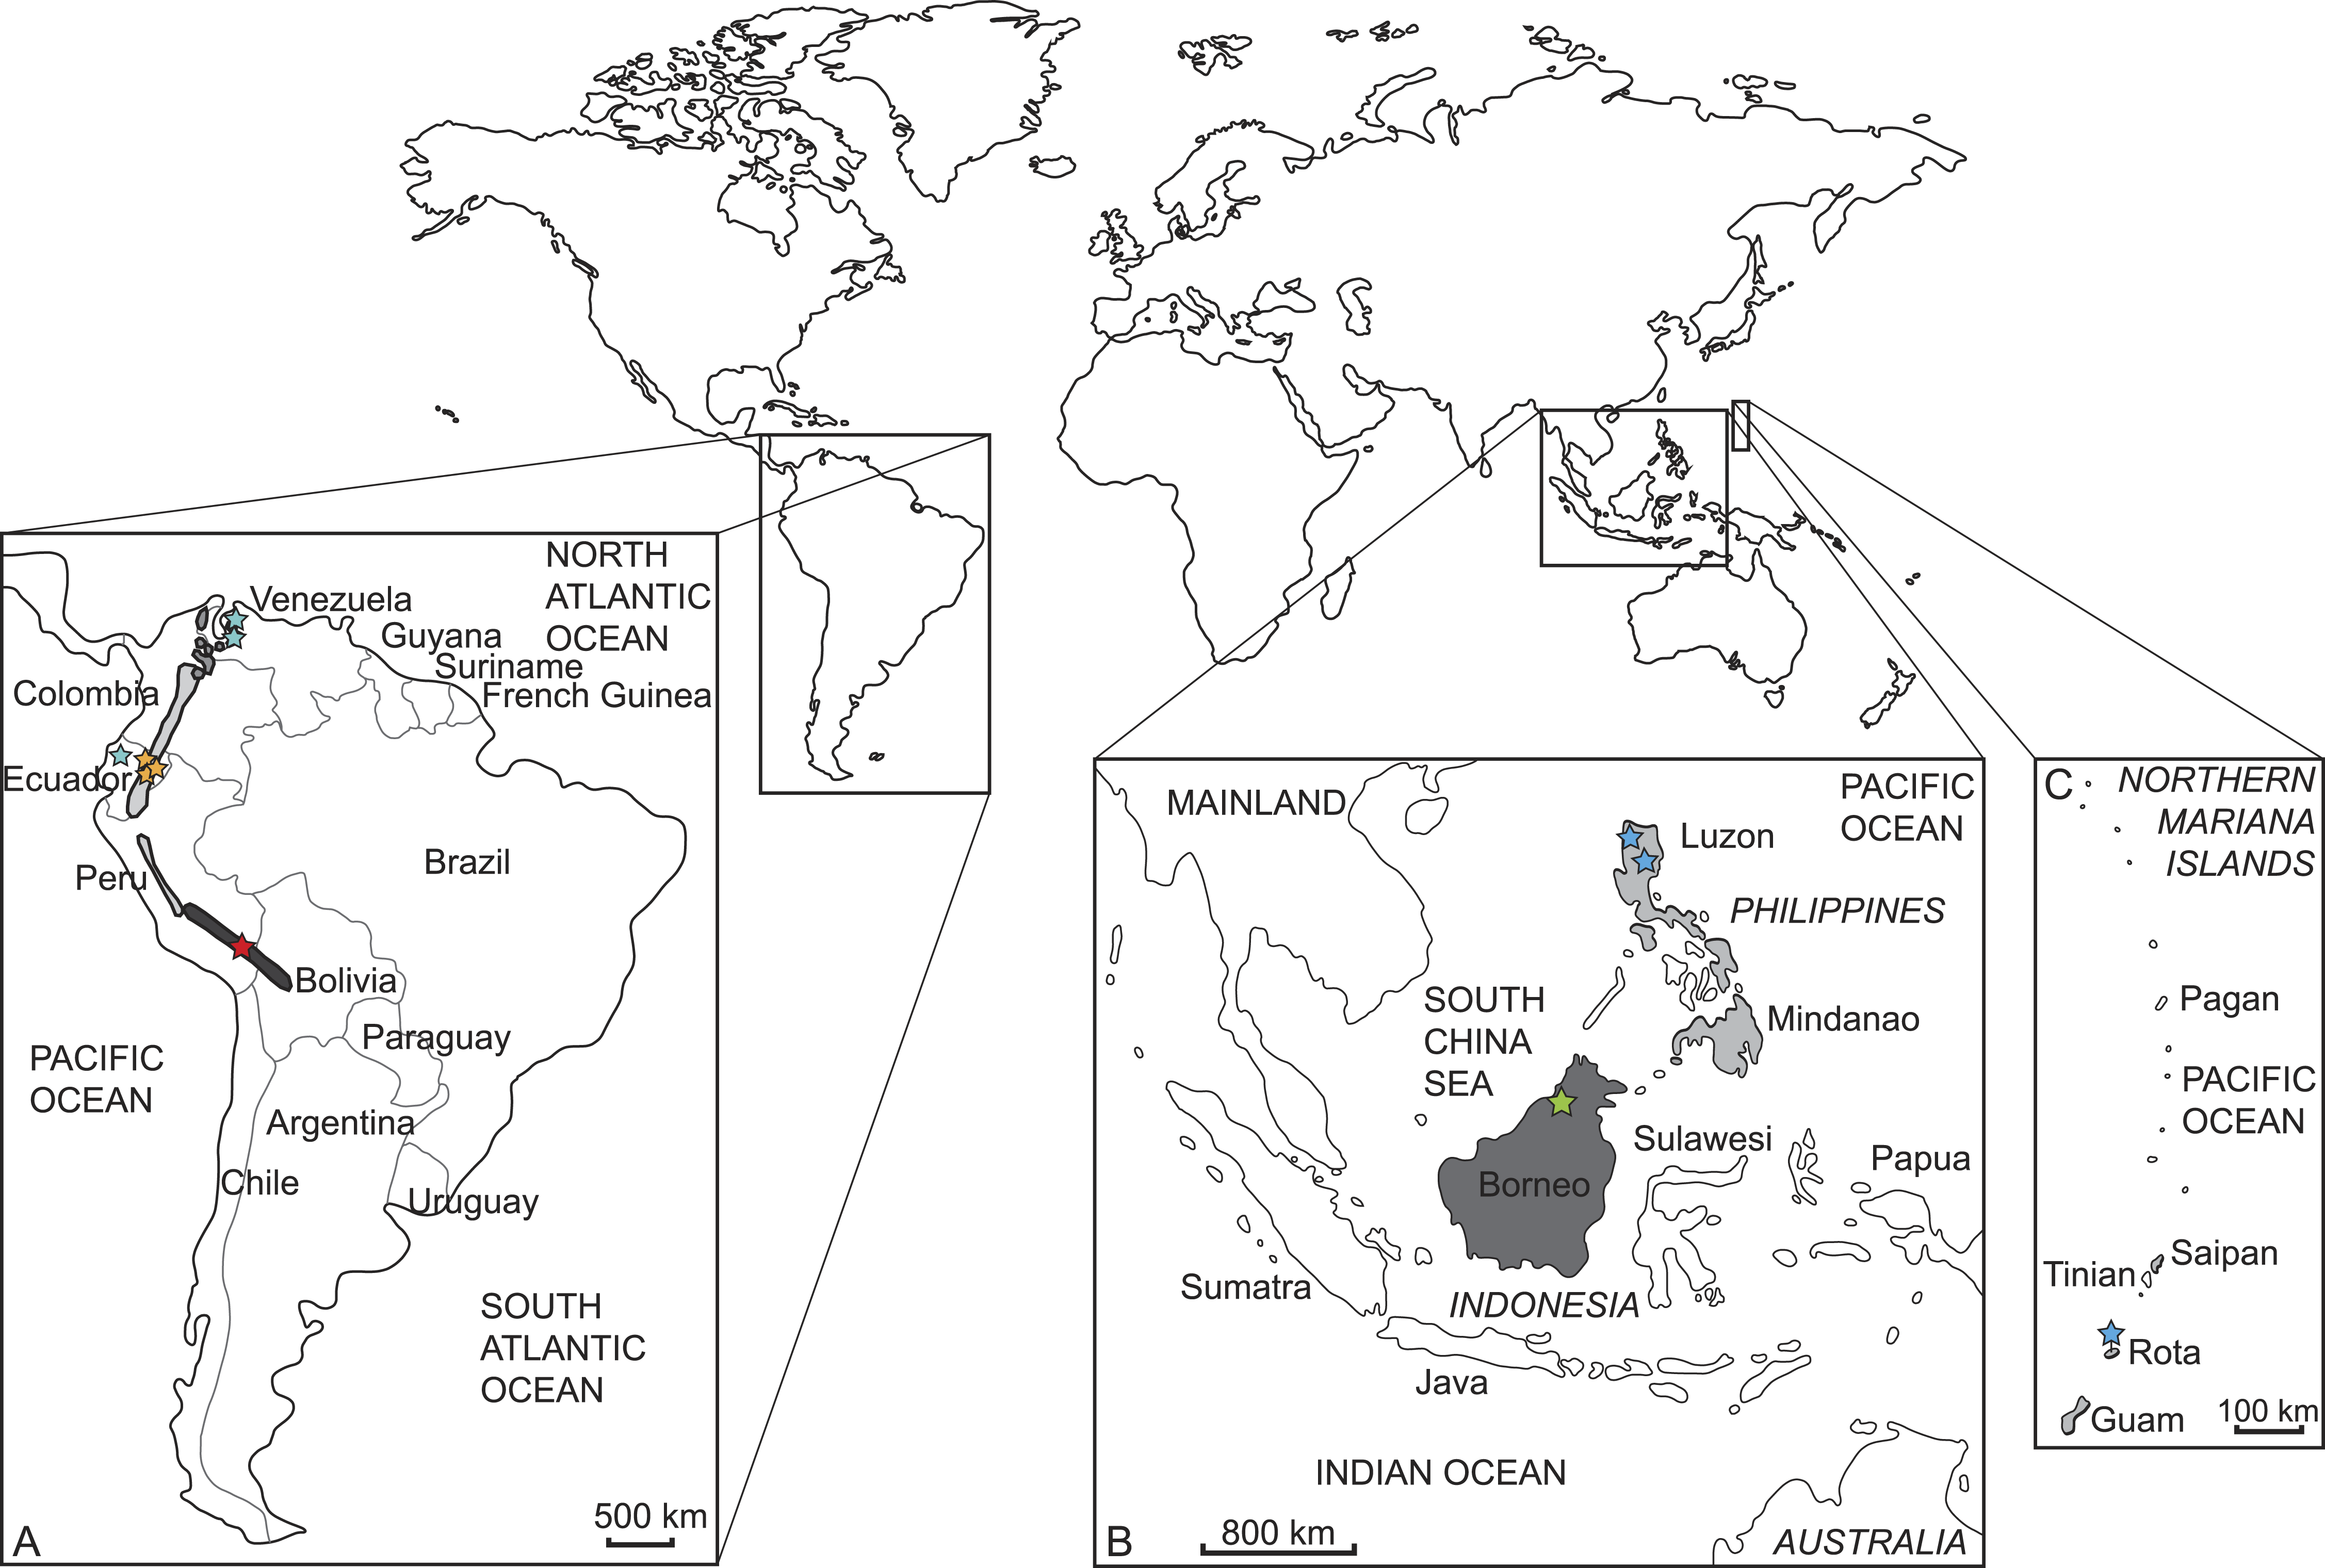
We sampled and sequenced five species from which no molecular data were available previous to our study (but see Gutiérrez et al., 2015) (Tables 1 and 2). Samples were taken from thirteen museum specimens, nine from the Natural History Museum in London (BMNH) and four from the Museum für Naturkunde Berlin (ZMB). Three specimens represent holotypes (BMNH 1908.6.24.5 Mazama bricenii, BMNH 1971.3088 Muntiacus atherodes, BMNH 1896.1.28.6 Pudu mephistophiles). One sample was derived from a wet specimen, one from a skin, and the remaining samples consisted of bone fragments or dried soft tissue remains of skulls (details in Table 2). Figure 2 shows where the specimens originated and their currently known species distributions. The collection dates of each specimen are given in Table 2.
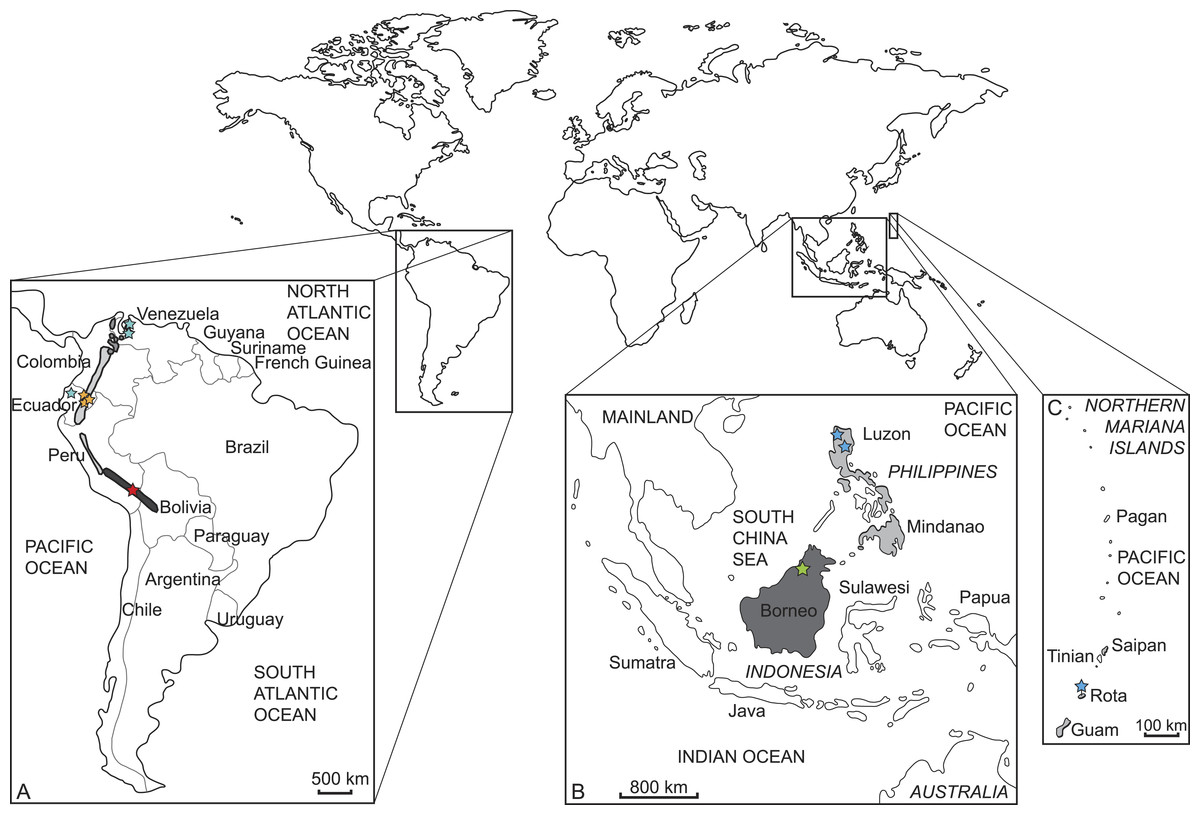
Figure 2: Current distribution of the sampled species and the approximate sampling localitions of the specimens.
(A) Enlarged map of South America; dark grey/red star: Mazama chunyi, light grey/yellow stars: Pudu mephistophiles, medium grey/turquoise stars: Mazama bricenii. (B) Enlarged map of Indonesian and Philippine Islands and (C) enlarged map of the Northern Mariana Islands; dark grey/green star: Muntiacus atherodes, light grey/blue stars: Rusa marianna.| Species | Cytochrome b | mtGenome |
|---|---|---|
| Alces alces | AJ000026 | JN632595 |
| Alces americanus | M98484 | – |
| Axis axis | AY607040 | JN632599 |
| Axis kuhlii | HQ893538 | – |
| Axis porcinus | DQ379301 | JN632600 |
| Blastocerus dichotomus | JN632603 | JN632603 |
| AY607038 | ||
| NC_020682 | ||
| Capreolus capreolus | AJ000024 | JN632610 |
| Capreolus pygargus | AJ000025 | – |
| Cervus albirostris | AY044863 | JN632690 |
| AF423202 | ||
| Cervus elaphus canadensis | AF423198 | – |
| EF139147 | ||
| Cervus elaphus | JF489133 | NC_007704 |
| Cervus nippon | JF893484 | NC_006993 |
| Dama dama | AJ000022 | JN632629 |
| Dama mesopotamica | AY607034 | JN632630 |
| Elaphodus cephalophus | NC_008749 | NC_008749 |
| Elaphurus davidianus | AF423194 | JN632632 |
| Hippocamelus antisensis 1 | JN632646 | JN632646 |
| NC_020711 | ||
| Hippocamelus antisensis 2 | DQ379307 | |
| GU190862 | ||
| Hippocamelus bisulcus | DQ789177 | – |
| DQ789178 | ||
| GU190863 | ||
| Hydropotes inermis | AJ000028 | JN632649 |
| Mazama americana 1 | DQ789209 | JN632656 |
| DQ789217 | ||
| Mazama americana 2 | JN632657 | |
| Mazama americana 3 | DQ789221 | |
| JN632656 | ||
| NC_020719 | ||
| Mazama americana 4 | DQ789201 | |
| DQ789204 | ||
| Mazama americana 5 | DQ789219 | |
| Mazama bororo | DQ789187 | – |
| DQ789231 | ||
| DQ789228 | ||
| Mazama bricenii | LT546656 | – |
| LT546657 | ||
| LT546658 | ||
| Mazama chunyi | LT546655 | – |
| Mazama gouazoubira 1 | JN632658 | JN632658 |
| NC_020720 | ||
| Mazama gouazoubira 2 | DQ379308 | |
| Mazama nana | DQ789210 | – |
| DQ789214 | ||
| DQ789227 | ||
| Mazama nemorivaga 1 | JN632660 | JN632660 |
| Mazama nemorivaga 2 | DQ789205 | |
| DQ789206 | ||
| DQ789226 | ||
| JN632659 | ||
| NC_024812 | ||
| Mazama pandora | KC146954 | – |
| KC146955 | ||
| Mazama rufina | JN632661 | JN632661 |
| NC_020721 | ||
| Mazama temama | KC146956 | – |
| KC146957 | ||
| KC146958 | ||
| KC146959 | ||
| † Megaloceros giganteus | AM182644 | – |
| AM182645 | ||
| Muntiacus atherodes | LT546659 | – |
| Muntiacus crinifrons | NC_004577 | NC_004577 |
| AY239042 | ||
| DQ445734 | ||
| DQ445732 | ||
| DQ445735 | ||
| DQ445733 | ||
| Muntiacus feae | AF042721 | – |
| Muntiacus muntjak 1 | NC_004563 | NC_004563 |
| AY225986 | ||
| Muntiacus muntjak 2 | AF042718 | |
| Muntiacus putaoensis | EF523665 | – |
| EF523666 | ||
| EF523667 | ||
| EF523668 | ||
| EF523669 | ||
| Muntiacus reevesi | AF527537 | NC_008491 |
| NC_004069 | ||
| Muntiacus rooseveltorum | KJ425278 | – |
| KJ425279 | ||
| KJ425281 | ||
| KJ425282 | ||
| Muntiacus truongsonensis 1 | KJ425277 | – |
| Muntiacus truongsonensis 2 | KJ425276 | |
| Muntiacus vuquangensis | FJ705435 | FJ705435 |
| AF042720 | ||
| NC_016920 | ||
| Odocoileus hemionus 1 | HM222707 | JN632670 |
| Odocoileus hemionus 2 | FJ188783 | |
| FJ188870 | ||
| Odocoileus virginianus 1 | DQ379370 | JN632671 |
| Odocoileus virginianus 2 | M98491 | |
| Ozotoceros bezoarticus | DQ789190 | JN632681 |
| DQ789193 | ||
| DQ789195 | ||
| DQ789199 | ||
| Pudu mephistophiles | JN632691 | – |
| LT546651 | ||
| LT546652 | ||
| LT546653 | ||
| LT546654 | ||
| Pudu puda | JN632692 | JN632692 |
| AY607039 | ||
| NC_020740 | ||
| Rangifer tarandus | AB245426 | NC_007703 |
| AY726704 | ||
| KM506758 | ||
| Rucervus duvaucelii | AY607041 | JN632696 |
| Rucervus eldii | AY157735 | JN632697 |
| Rucervus schomburgki | AY607036 | – |
| Rusa alfredi | JN632698 | JN632698 |
| NC_020744 | ||
| Rusa marianna | LT546647 | – |
| LT546648 | ||
| LT546649 | ||
| LT546650 | ||
| Rusa timorensis | AF423200 | JN632699 |
| Rusa unicolor | FJ556575 | NC_008414 |
| Antilocapra americana | JN632597 | JN632597 |
| Boselaphus tragocamelus | EF536350 | EF536350 |
| Hyemoschus aquaticus | JN632650 | JN632650 |
| Moschus moschiferus | FJ469675 | JN632662 |
| Okapia johnstoni | JN632674 | JN632674 |
| Tragelaphus scriptus | AF022067 | JN632706 |
We obtained complete Cytb and/or mitochondrial genome sequences from NCBI GenBank (http://www.ncbi.nlm.nih.gov/genbank/) for 48 cervid species. These included the 45 extant cervids (full set of available extant cervid data excluding recently published M. bricenii sequences; Gutiérrez et al., 2015), one subspecies (Cervus elaphus canadensis), a questionable P. mephistophiles sequence from Hassanin et al. (2012), and one fossil cervid species (Megaloceros giganteus). We also added six non-cervid ruminant taxa (Table 1). The resulting Cytb data set is the most taxonomically extensive for Cervidae to date.
| Species | Collection ID | Accession no. | Sample (mg) | DNA (ng/µl) | Gaps in alignment | Collection entry | Locality | Material |
|---|---|---|---|---|---|---|---|---|
| Rusa marianna | BMNH 1996.2 | LT546647 | 15.5 | 93.65 | – | 1996 | Philippines | Soft tissue fragments* |
| Rusa marianna | ZMB-MAM-75158 | LT546648 | 15.1 | 60.97 | – | NA | Philippines, Luzon | Soft tissue & bone fragments* |
| Rusa marianna | ZMB-MAM-20409 | LT546649 | 12.0 | 49.64 | – | 1915 | Captive animal | Soft tissue & bone fragments* |
| Rusa marianna | ZMB-MAM-75146 | LT546650 | 26.2 | 38.67 | 403–467 | 1905 | US, Northern Mariana Islands | Soft tissue & bone fragments# |
| Pudu mephistophiles | BMNH 1899.2.18.20 | LT546651 | 30.5 | 97.35 | 64–118, 176–211 | 1899 | Ecuador | Soft tissue & bone fragments*; juvenile |
| Pudu mephistophiles | BMNH 1896.1.28.6 | LT546652 | 7.6 | 56.57 | – | 1896 | Ecuador, Paramo of Papallacta | Snippet of skin, including hair; immature |
| Pudu mephistophiles | BMNH 1899.2.18.21 | LT546653 | 9.9 | 27.34 | 604–674, 784–810 | 1899 | Ecuador | Soft tissue & bone fragments*; juvenile |
| Pudu mephistophiles | ZMB-MAM-61577 | LT546654 | 165.8 | 325.57 | – | 1970 | Captive animal | Wet specimen; neonatal |
| Mazama chunyi | BMNH 1967.1362 | LT546655 | 15.6 | 56.22 | – | 1967 | Peru, Chiquis | Soft tissue & bone fragments** |
| Mazama bricenii | BMNH 1913.4.24.3 | LT546656 | 36.0 | 74.17 | – | 1913 | Venezuela, Merida | Soft tissue & bone fragments* |
| Mazama bricenii | BMNH 1908.6.24.5 | LT546657 | 2.4 | 7.07 | 288–394, 604–674 | 1908 | Venezuela | Soft tissue & bone fragments* |
| Mazama bricenii | BMNH 1934.9.10.228 | LT546658 | 10.2 | 77.08 | – | 1934 | Ecuador, Pichincha | Soft tissue & bone fragments* |
| Muntiacus atherodes | BMNH 1971.3088 | LT546659 | 23.3 | 87.60 | – | 1971 | Borneo, Brunei/ Indonesia/Malaysia | Soft tissue & bone fragments** |
Extraction
The challenges of sequencing ancient DNA are related to the degradation of DNA after an organism’s death triggered by exogenous processes such as oxidation and background radiation. These processes affect the sugar-phosphate backbone and nitrous bases of the DNA strand, whereas hydrolytic processes such as depurination and deamination cause breakage in the DNA molecules (Hofreiter et al., 2001b). Due to the large number of mitochondria per cell, mitochondrial gene sequences are more likely to be retrieved from ancient material than is nuclear DNA (Hofreiter et al., 2001a).
DNA was extracted using the Qiagen QIAamp DNA Micro Kit, including an overnight lysis step, following the manufacturer’s protocol. After lysis, 1 µg dissolved carrier RNA was added, as recommended in the protocol, 80 µl elution buffer was used for the last elusion step, and the last incubation step was set for five minutes instead of one minute. After the extraction, the DNA concentration was measured using a spectrometer (NanoDrop 1000; Peqlab Biotechnologie GmbH, software version ND 1000 v3.7.1) (Table 2).
PCR
Eight cervid-specific Cytb primers (Lister et al., 2005) were used to amplify a 747 base pair region from the 1140-base-pair-long mitochondrial Cytb, from nucleotide position 64 to 810. Each primer pair amplified a 100–140-base-pair-long sequence with overlap to adjacent sequences (Lister et al., 2005; Table 2).
| Reagents | Quantity (µl) | |||
|---|---|---|---|---|
| a | b | c | d | |
| PCR Flexi-Buffer (5X) | 2.5 | 2.5 | 2.5 | 5 |
| MgCl2 (25 mM) | 1.5 | 1.5 | 2 | 3 |
| dNTPs (10 mM) | 0.5 | 0.5 | 0.5 | 1 |
| Primer forward (5 µM) | 0.5 | 0.5 | 0.5 | 1 |
| Primer reverse (5 µM) | 0.5 | 0.5 | 0.5 | 1 |
| BSA | 1.3 | 0 | 0 | 0 |
| H2O | 4.6 | 5.9 | 5.4 | 12.9 |
| GoTaq polymerase | 0.1 | 0.1 | 0.1 | 0.1 |
| DNA | 1 | 1 | 1 | 1 |
| Total reaction volume | 12.5 | 12.5 | 12.5 | 25 |
Polymerase chain reactions (PCR) were carried out using a TProfessional thermocycler (Biometra). Sequences amplified from each primer pair were validated against contamination with a negative control. The specific PCR components are given in Table 3. The PCR programme was as follows: initial denaturation at 95 °C for three minutes, then 35 cycles of denaturation at 95 °C for 30 s, annealing at 55 °C for 30 s, and extension at 72 °C for 30 s, and a final extension at 72 °C for five minutes. Amplification of target sequences was initially attempted using the components in Table 3, column (a) and an annealing temperature of 55 °C. Some primer-sample combinations did not result in amplification products. Therefore, we experimented with the components, e.g., not adding Bovine Serum Albumin (BSA), changing the overall reaction volume, and/or increasing the concentration of magnesium chloride (Table 3). We also experimented with annealing temperatures ranging from 48 °C to 52 °C. These optimisations were successful in most cases; however, a few sections of the individual sequences for certain specimens could not be successfully amplified, which left gaps in the Cytb sequence (Table 2).
Successfully amplified PCR products were sequenced in both directions using the amplification primers and the ABI BigDyeTerminator 3.1 chemistry following the manufacturer’s protocol on a capillary sequencer (ABI 3730; AppliedBiosystems) in the Genomic Sequencing Unit, Faculty of Biology, LMU. After quality control, the approximately 100–140-base-pair-long forward and reverse sequencing reads were assembled into contigs. These individual contigs were then assembled into a contig with a maximum length of 747 base pairs using CodonCodeAligner v.3.7.1.1.
To ensure that a genuine cervid Cytb fragment has been amplified, the forward and reverse pre-assembly sequences from each primer, the individual contigs of forward and reverse strands and the final 747-base-pair-long contigs were each BLASTed against NCBI GenBank entries. Only fragments returning a cervid in the first 50 BLAST search results were used. In almost all cases, where the BLAST result was different from the cervid result, the sequences were found to be most similar to Bos taurus. This contamination is possibly caused by the BSA added to enhance PCR outcomes. Sequences were submitted to the European Nucleotide Archive under accession numbers LT546647 –LT546659 (Tables 1 and 2).
Alignment
The concatenated consensus sequences of each specimen were added to the existing Cytb data set (NCBI GenBank) and pairwise aligned by eye using Mesquite v.2.75 (Maddison & Maddison, 2011) and Seaview 4.2 (Gouy, Guindon & Gascuel, 2010). The alignment was carefully checked for stop codons within the alignment and/or unusual nucleotide positions by translation into amino acids to ensure the absence of pseudogenes and sequencing errors. The IUPAC ambiguity code was used in few cases where character states could not be assessed unambiguously after a re-investigation of the raw sequence data. These ambiguities most likely represent misreads from the chromatogram due to the somewhat poor condition of the DNA. Because these ambiguous sites are not numerous, their impact on the phylogenetic signal is negligible.
In total, three different alignments were created. First, we aligned the new 747 base pair long sequences with the complete Cytb sequences from GenBank to form a data set of 1140 base pairs. The final data set contained 130 taxa (124 cervids, six other ruminants). Second, to test whether the newly sequenced, shorter fragments carried a sufficient phylogenetic signal, two further alignments were created. One alignment was exactly 747 base pairs long, which was the same length as the new sequences, including internal gaps. The other alignment excluded even the internal gaps and was 569 base pairs long. We also re-analysed the cervid subset (33 species) of the complete mitochondrial genome alignment available for Artiodactyla in Hassanin et al. (2012) without the new sequences. The taxon sampling contained 39 cervid taxa and seven non-cervid ruminants.
Phylogenetic analyses
To test for the impact of alignment length on phylogenetic signal, we developed three alignments with varying base pair lengths. For each alignment, we used PartitionFinder (Lanfear et al., 2012) to identify the optimal partitioning scheme and mutation model (Table 4).
| Analysis | Reference | Model(s) | Partitioned | Cervidae | Cervinae | Cervini | Muntiacini | Capreolinae | Capreolini | Odocoileini | Blastocerina | Odocoileina |
|---|---|---|---|---|---|---|---|---|---|---|---|---|
| BI-mtG | Fig. 3A, Fig. S1 | GTR | Y | 1 | 1 | 1 | 1 | 1 | 1 | 1 | 1 | 1 |
| BI-1140-unpart | Fig. 3B, Fig. 4, Fig. S2 | GTR | N | 1 | 1 | 1 | 1 | – | 1 | .84 | .98 | .99 |
| BI-1140-part | Fig. 3C, Fig. S3 | SYM | Y | 1 | .99 | 1 | 1 | – | 1 | – | .75 | .87 |
| HKY | ||||||||||||
| GTR | ||||||||||||
| ML-1140 | Fig. 3D, Fig. S4 | GTR | N | 99 | 89 | 99 | 92 | – | 100 | 57 | 55 | 41 |
| BI-747-unpart | Fig. 3E, Fig. S5 | GTR | N | 1 | 1 | 1 | .81 | – | 1 | – | .85 | – |
| BI-747-part | Fig. 3F, Fig. S6 | SYM | Y | 1 | .99 | 1 | .90 | – | 1 | – | – | – |
| HKY | ||||||||||||
| GTR | ||||||||||||
| BI-569-unpart | Fig. 3G, Fig. S7 | GTR | N | 1 | – | .99 | .92 | – | 1 | – | – | – |
Notes:
- BI
-
Bayesian Inference
- ML
-
Maximum Likelihood, the number represents the Cytb sequence length in the current alignment
- Y
-
yes
- N
-
no
- part
-
partitioned
- unpart
-
unpartitioned
The values within cells represent the node support for the respective split either as Bayesian posterior probabilities or as bootstrap support from maximum likelihood analyses; “–” indicates that the clade was not recovered in the respective analysis.
A summary of all analyses undertaken including the models and partitioning scheme, is shown in Table 4. PartitionFinder analysis on the 1140 Cytb data set resulted in a scheme with three different partitions for the individual codon positions using SYM for position 1, HKY for position 2, and GTR for position 3 for Bayesian inference analyses with MrBayes v.3.2.4 (Ronquist et al., 2012) (in the following referred to as BI-1140-part). For the maximum likelihood analyses with RAxML (Stamatakis, 2006), PartitionFinder suggested GTR for all codon positions (ML-1140). Alternatively, we undertook a Bayesian inference analysis without partitioning using the GTR model on the 1140-base-pair-long alignment (BI-1140-unpart). We also undertook a Bayesian analysis with the Cytb alignment reduced to 747 base pairs (BI-747-part) using the partitioning scheme suggested by PartitionFinder and the models decribed above as well as one unpartitioned analysis (BI-747-unpart) using GTR. Further, we undertook another Bayesian analysis on the 569 base pair alignment (BI-569-unpart), excluding the internal gaps, representing the shortest sequence length of the newly sequenced taxa (Maz_bri_Q_BMNH_1908.6.24.5). This analysis was run using the GTR model and no partitioning because of the short alignment length. The Bayesian re-analysis of the complete mitochondrial genome sequences (BI-mtG; without the newly sequenced Cytb sequences) was undertaken using GTR and divided the data set into seven partitions (Hassanin et al., 2012). The re-analysis was carried out because previous re-analyses of subsets of the complete mitochondrial genome resulted in different results than those found by Hassanin et al. (2012).
Substitution models for all analyses were implemented with a gamma distribution (Γ) without a proportion of invariant sites (I), although PartitionFinder suggested using Γ + I for most partitions. It is known that the combination Γ + I may create two areas of equal probability in the tree landscape, which can lead to convergence problems (Moyle et al., 2012). All Bayesian Inference analyses were run with MrBayes v.3.2.4 (Ronquist et al., 2012) using Metropolis-Coupled Markov Chain Monte Carlo (MC3); two separate runs sampled the tree landscape at a temperature of 0.35 sampling every 1,000th tree. The mitochondrial genome analysis was run with MrBayes v.3.2.4 (Ronquist et al., 2012) using MC3 with two separate runs sampling every 5,000th tree at a temperature of 0.35. All analyses automatically stopped when the standard deviation of split frequencies of posterior probabilities reached 0.01. From all post burn-in sampled trees, a consensus tree was generated (burn-in = 25%). For the Maximum Likelihood analysis we used RAxML v.7.3.0 (Stamatakis, 2006) including a rapid bootstrap search with 100 replicates on the 1140 base pair long data set.
Hyemoschus aquaticus (Tragulidae, Artiodactyla), which is an extant representative of crown ruminants, was used as the outgroup. The original tree topologies from all seven analyses are provided in Figs. S1–S7, and an overview is given in Fig. 3 and Table 4.
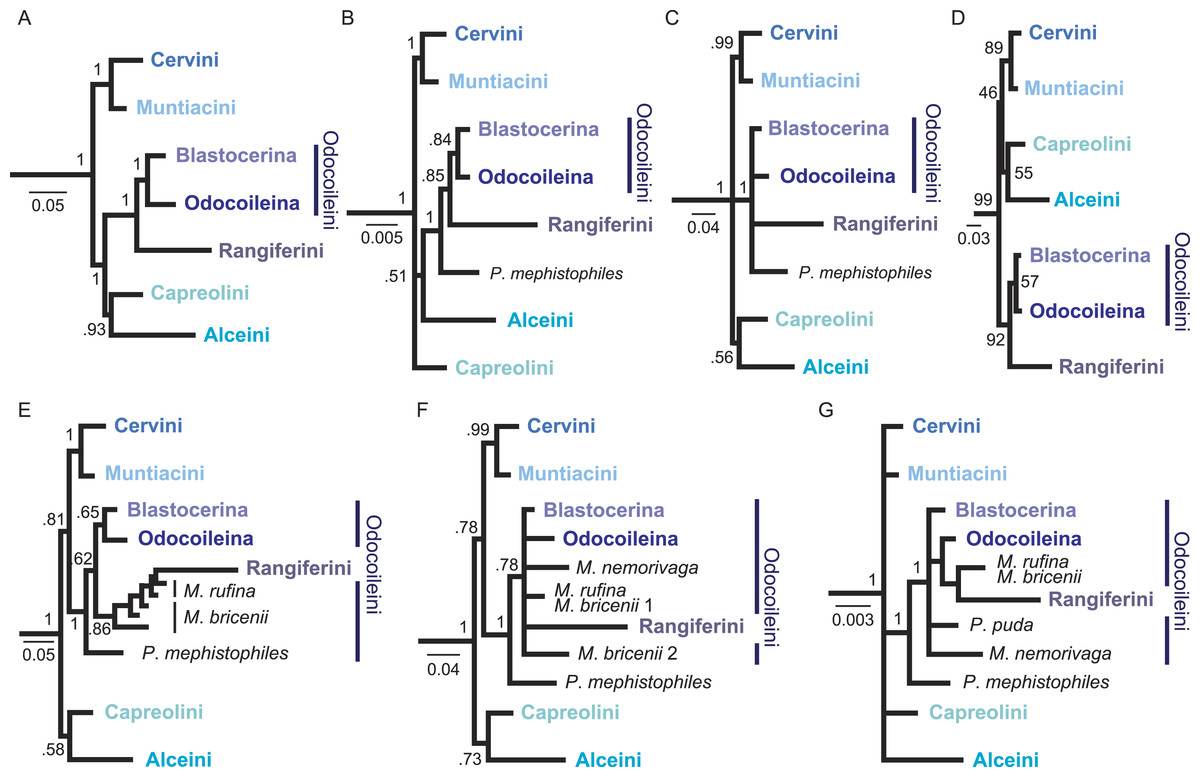
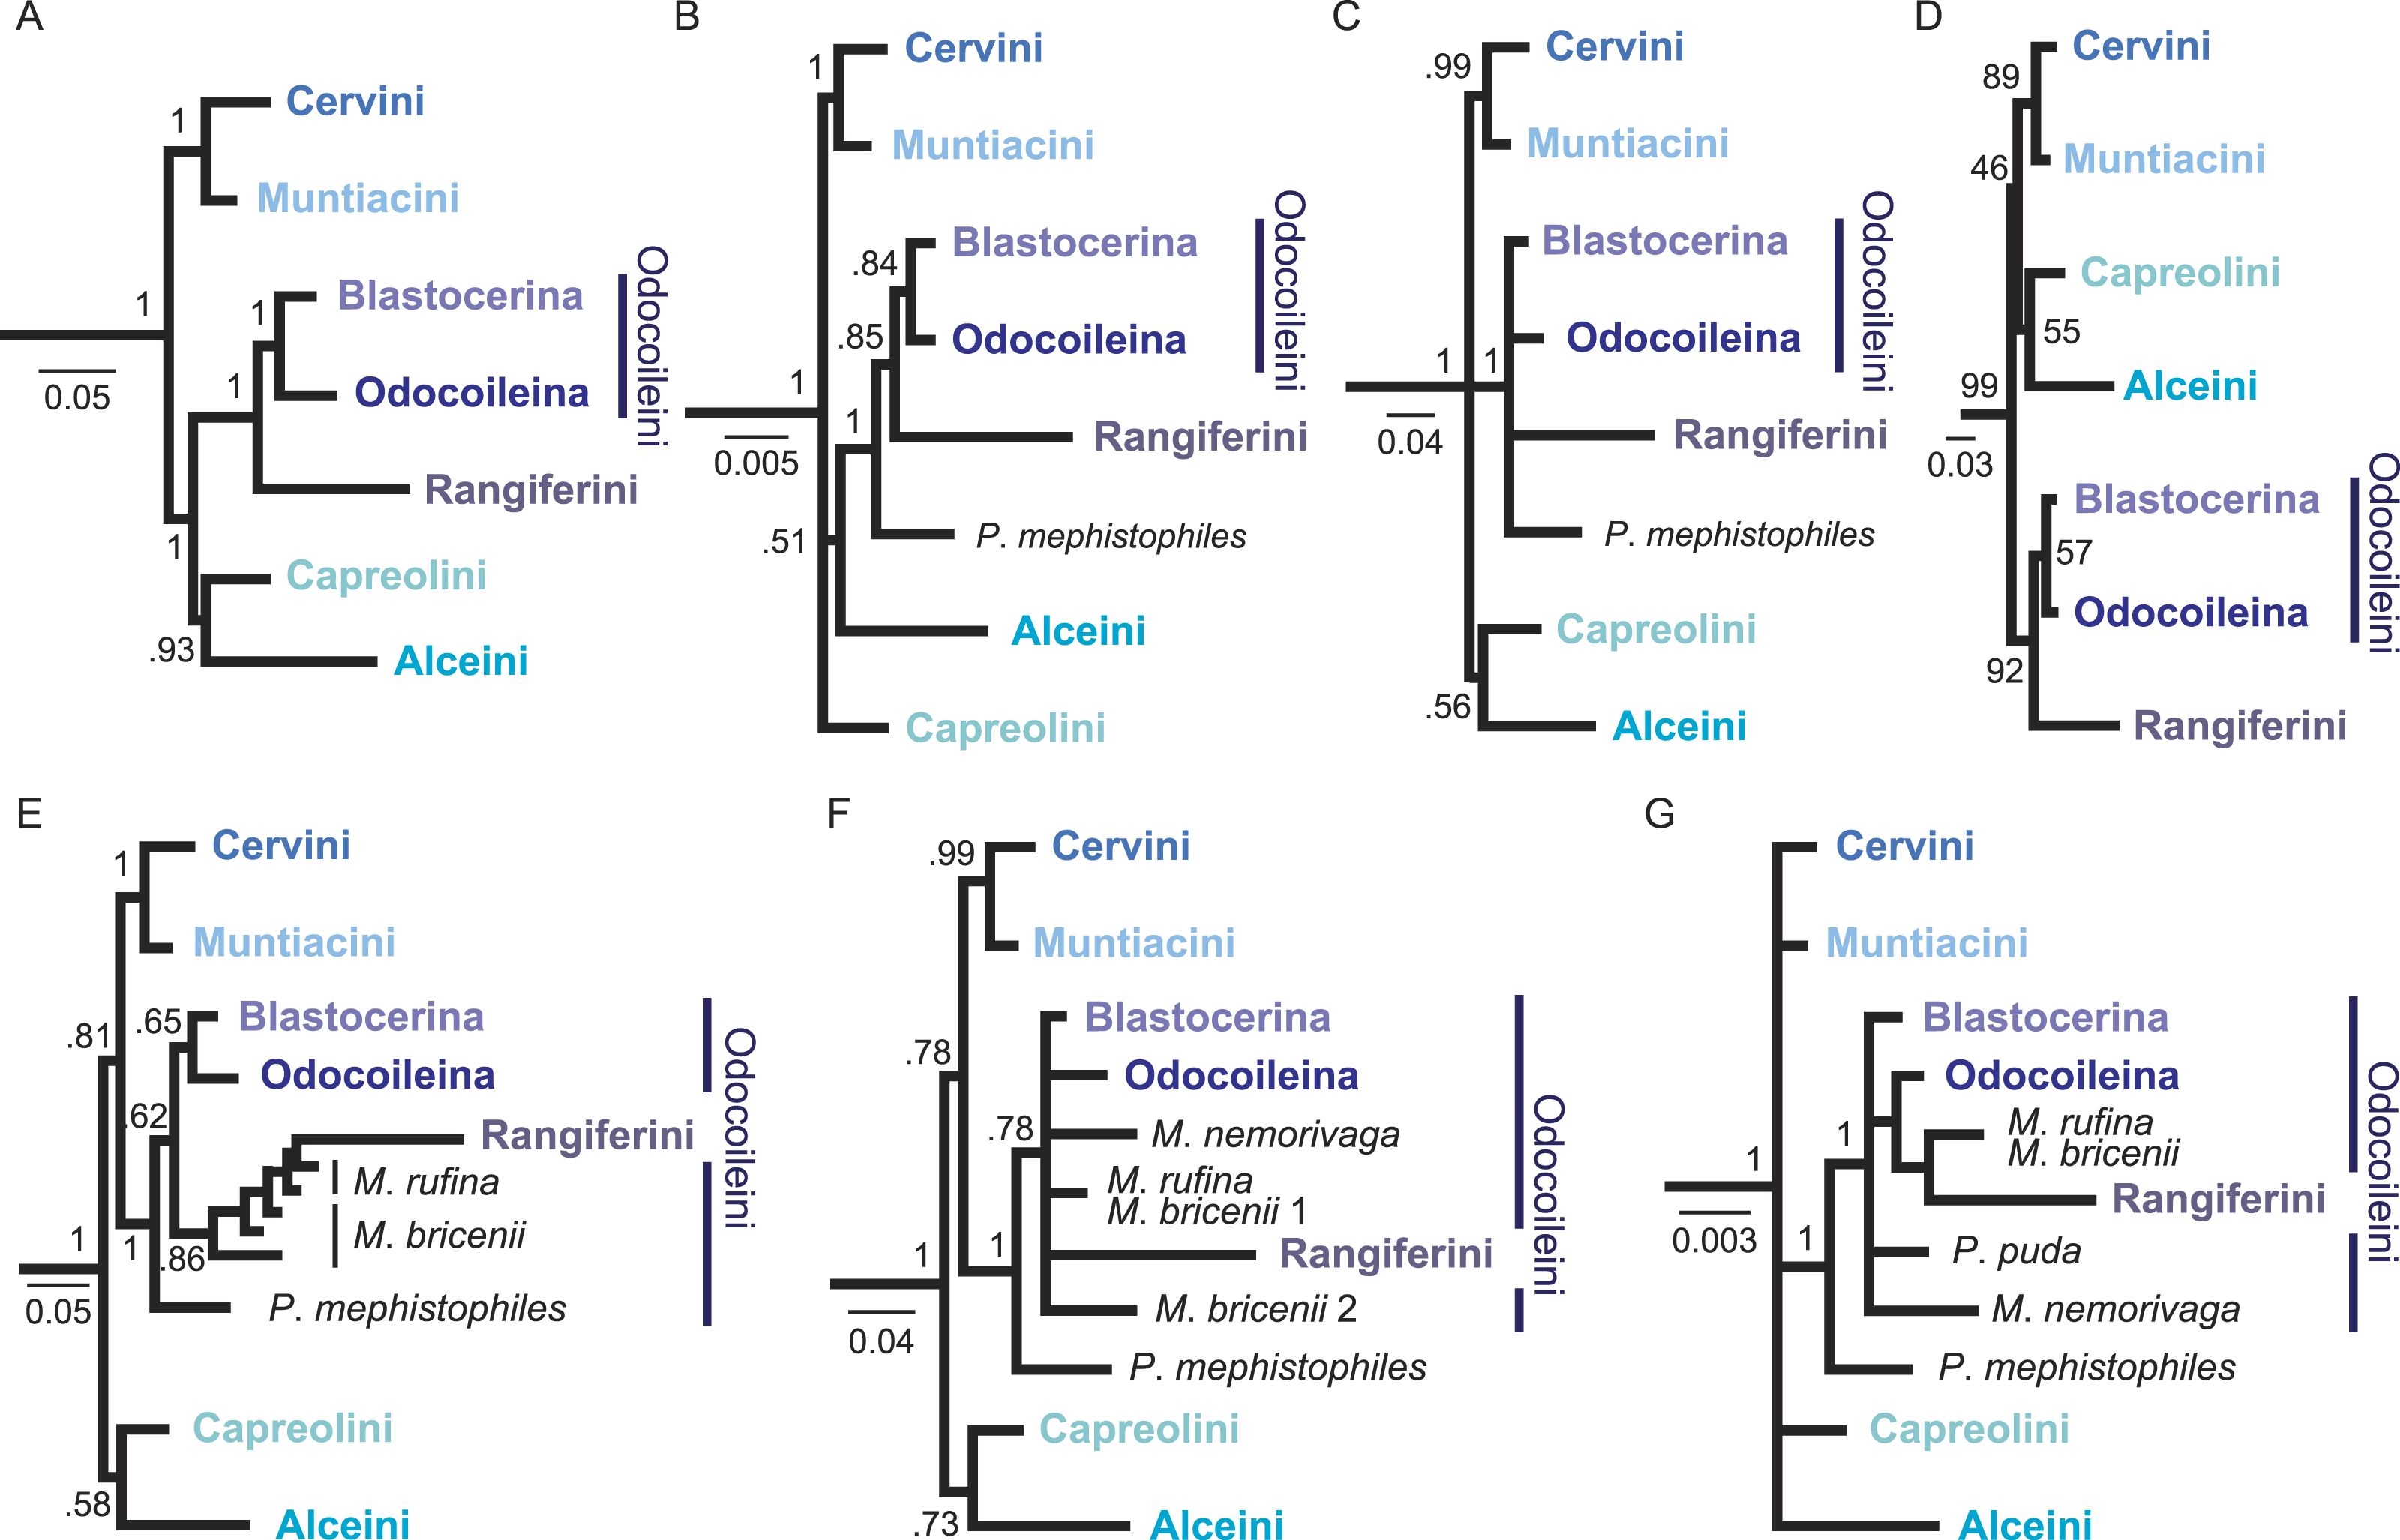
Figure 3: Overview of higher level topologies resulting from re-analysis of the complete mitochondrial genome sequences (Hassanin et al., 2012) and six different analyses of our data set.
(A) BI-mtG, (B) BI-1140-unpart, (C) BI-1140-part (D) ML-1140, (E) BI-747-unpart, (F) BI-747-part, (G) BI-569-unpart. Support values represent bootstrap values in D, all other support values are posterior probabilities. (A–D) show monophyly for all major cervid lineages, whereas in (E–G) resolution, particularly within Odocoileini is lost. Positioning P. mephistophiles proves to be difficult. Scale bars represent substitutions per site.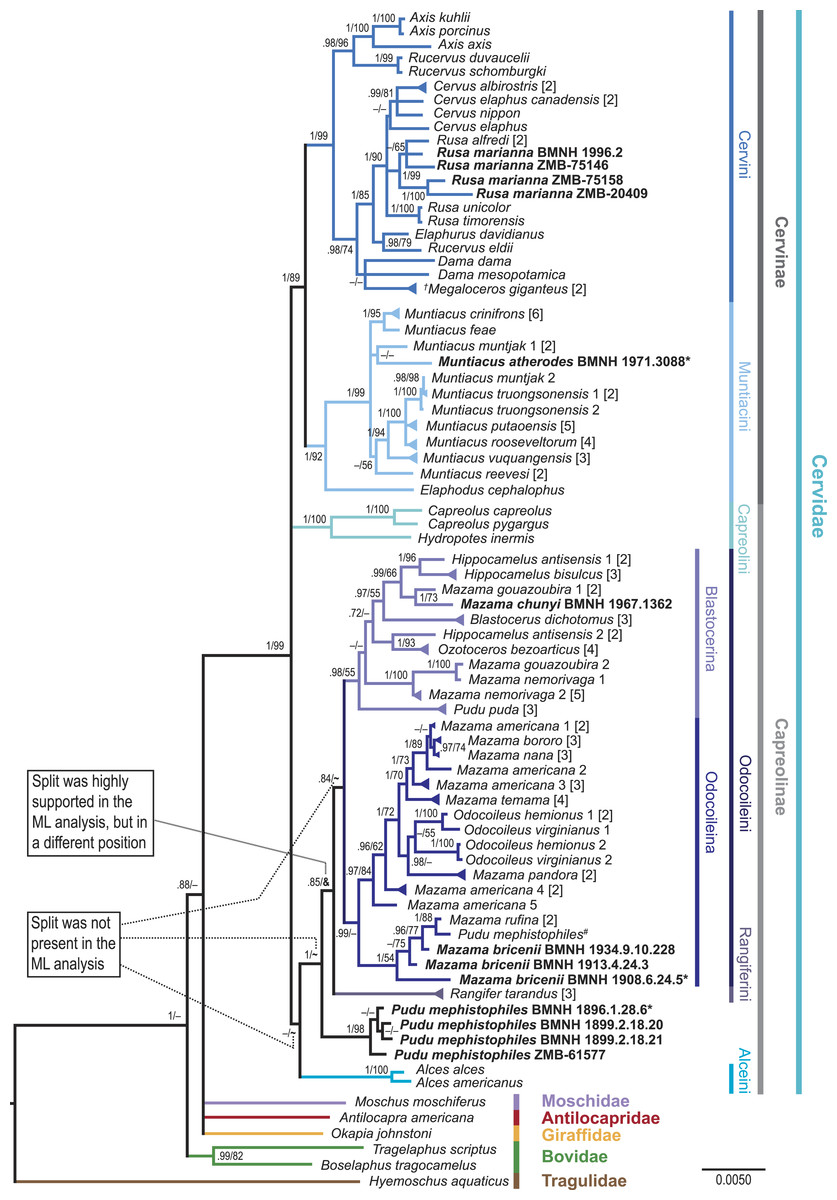
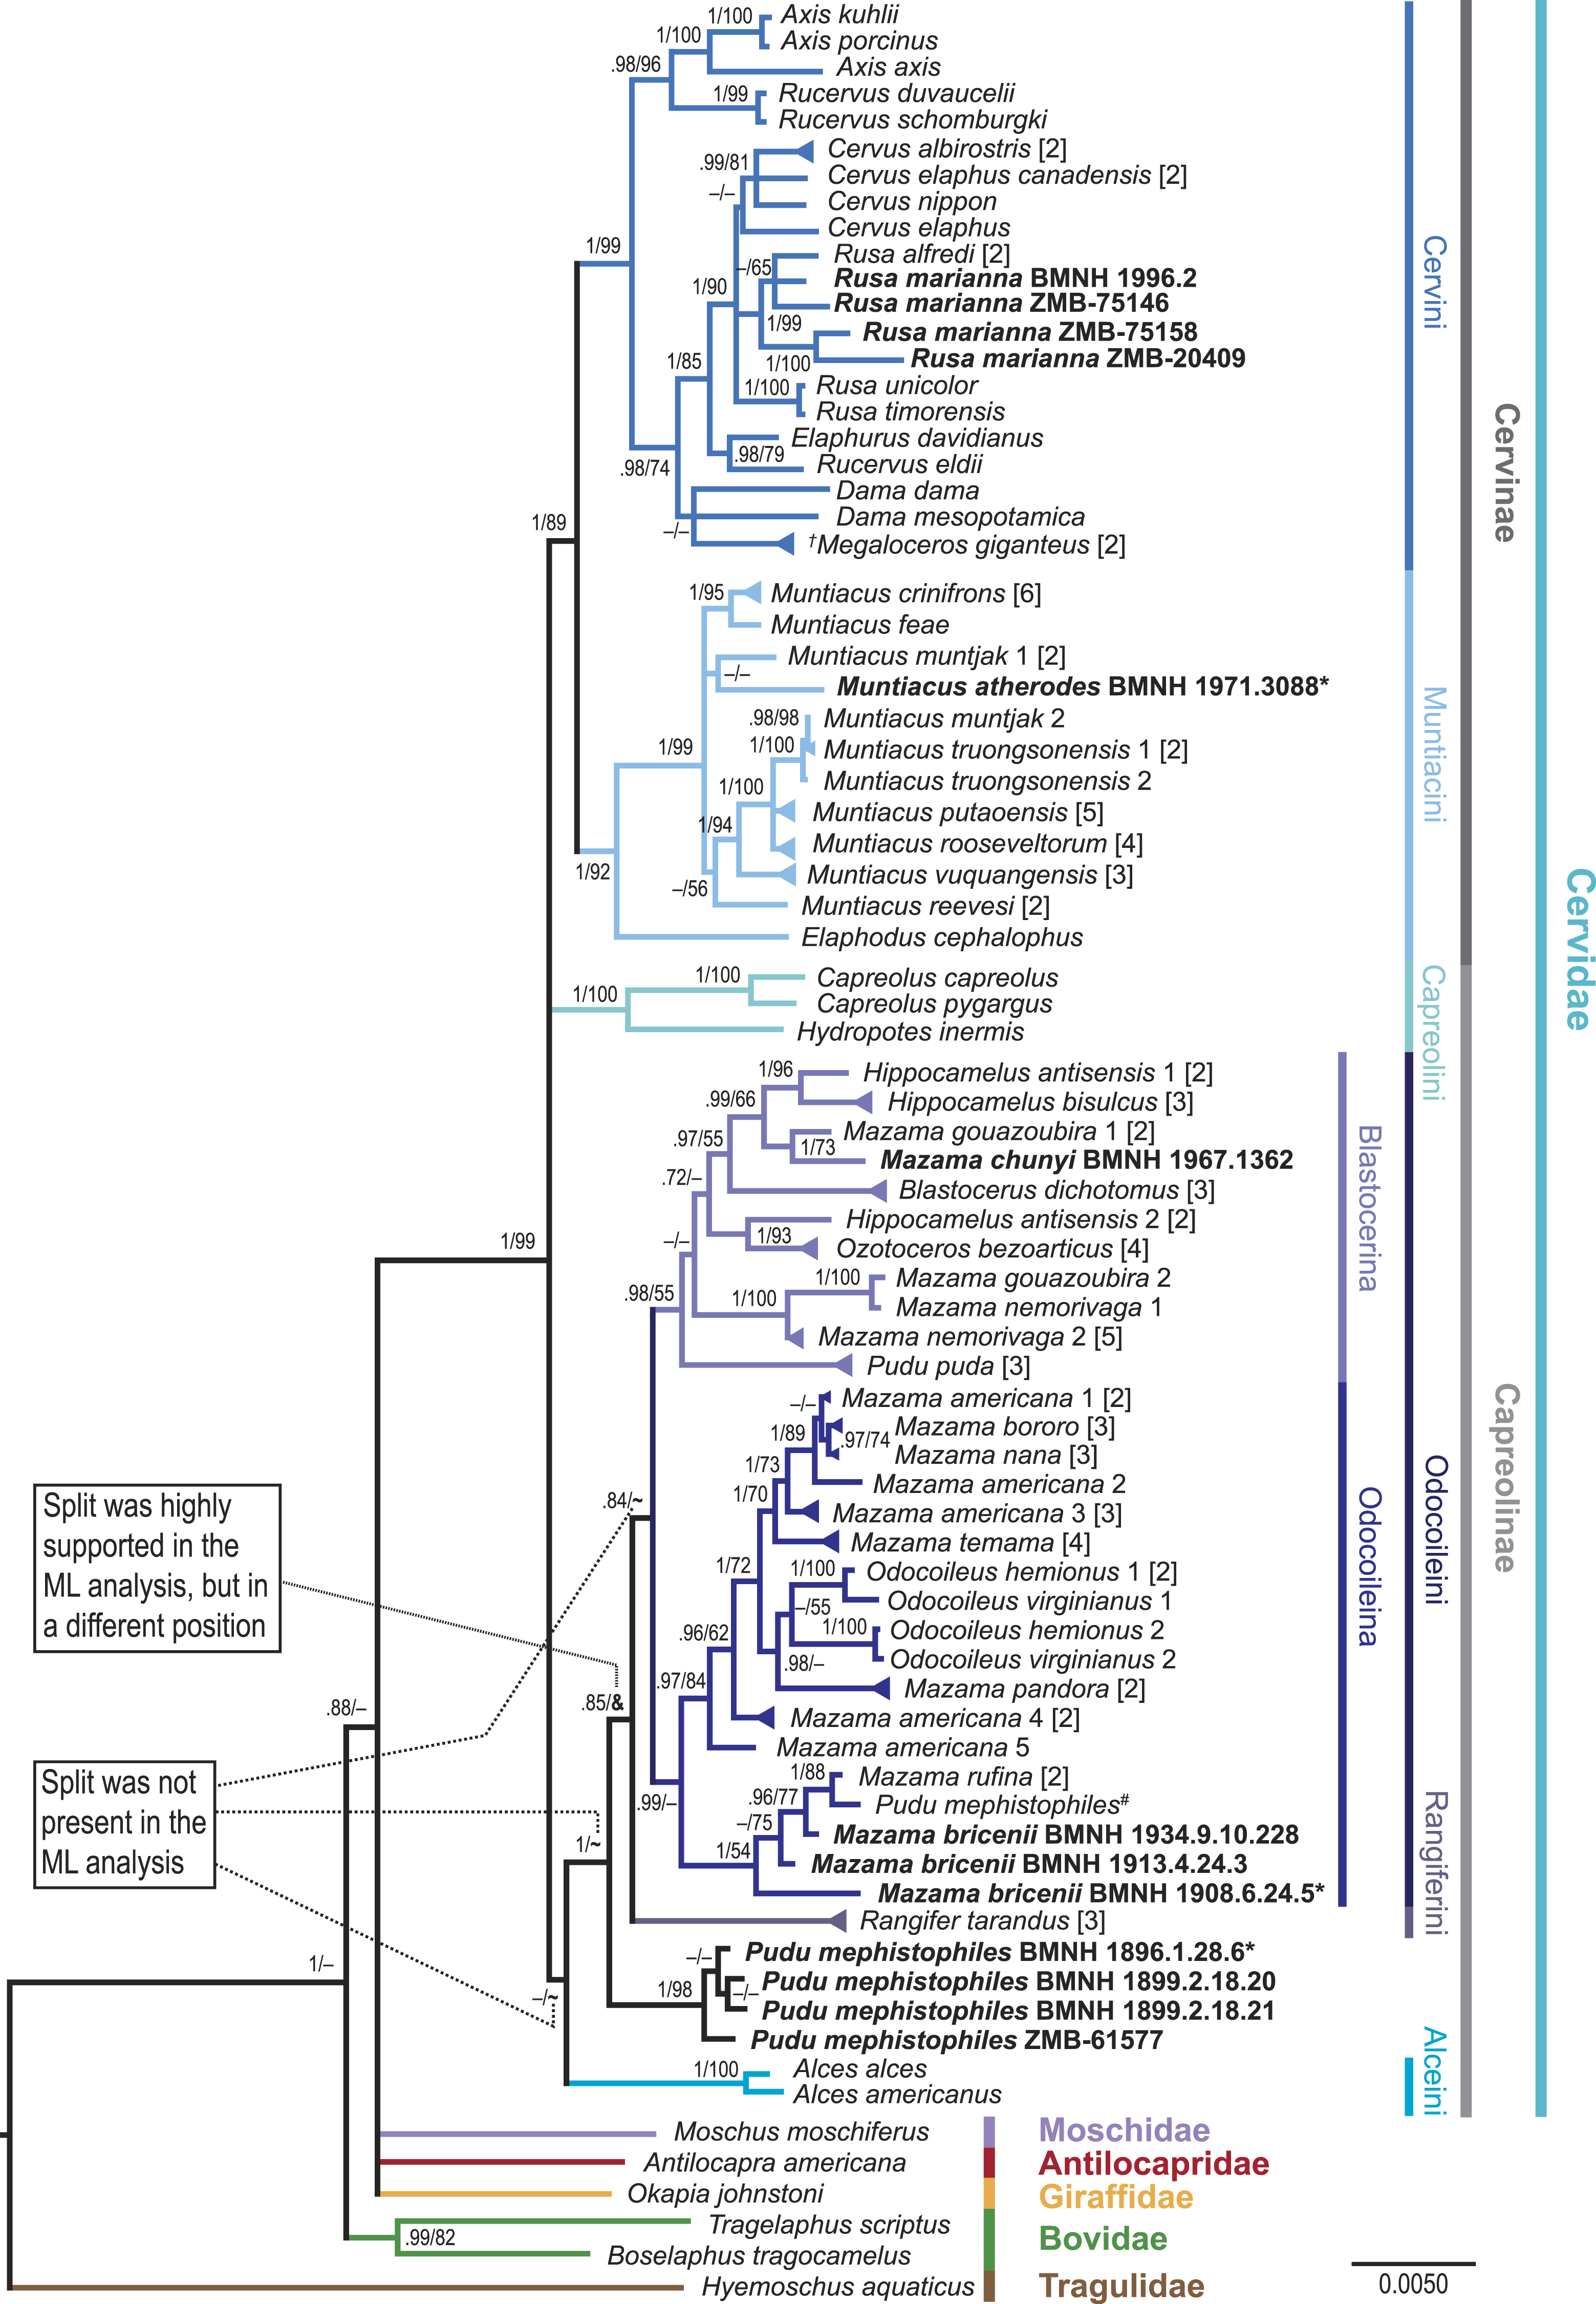
Figure 4: Consensus tree of the unpartitioned Bayesian Analyses (BI-1140-unpart).
Values represent posterior probabilities (PP), and if applicable, bootstrap (BS) support from the ML analysis is shown. Only values larger than 70% (PP) and 50% (BS) are displayed. If the support was not above 70% or 50%, but the split was present in one of the analyses; this is indicated by an “–”. “∼” indicates that the split was absent in the maximum likelihood analysis. “&” indicates that the split was absent in the maximum likelihood topology, but highly supported in a different position; this is only represented in the node separating Rangifer from the majority of Odocoileini (see Fig. S4). The numbers in square brackets indicate the number of individual sequences representing the taxon in the present analysis. If these multiple sequences representing one species were not identical, it is indicated by a triangular shaped tip of the branch. Taxa in bold are the newly sequenced specimens, asterisks indicate holotypes, and the hash indicates the putatively wrongly assigned P. mephistophiles sequence. Higher hierarchical taxa are shown on the right.Results
Extraction, PCR, sequencing
The results from the DNA extraction, PCR, and sequencing processes are summarised in Table 2. For some of the eight Cytb fragments, DNA amplification was not sufficient, which resulted in gaps in the sequence for a few specimens (Table 2). Upon checking the traces in CodonCodeAligner, we observed in our alignment that Y (C or T; n = 50) and R (G or A; n = 19) are the most common ambiguities. These nucleotide substitutions are most likely caused by hydrolytic deamination. This is a process by which the deamination of cytosine residues to form uracil residues, 5-methyl-cytosine residues to form thymine residues, or adenine residues to form hypoxanthine residues in the template DNA strand will be misread during the PCR process when a new DNA strand is synthesised. In turn, this leads to evident C → T or G → A substitutions (Hofreiter et al., 2001a.; Pääbo et al., 2004; Briggs et al., 2007; Briggs et al., 2010). Across our samples, Y ambiguities occurred up to ten times per specimen, and R ambiguities occurred up to three times per specimen. These numbers represent a very small proportion of approximately 1% of the overall sequence length of 747 base pairs. We tested the impact of the ambiguities on the reconstruction and found that the ambiguities did not tremendously influence the phylogenetic signal of the samples. However, these ambiguities represent an additional uncertainty in the analyses.
Phylogenetic analyses
The results from seven analyses are summarised in Table 4 and Fig. 3. Of the full 1140-base-pair-long Cytb data set 593 characters are constant, 68 variable characters are parsimony-uninformative, and 479 characters are parsimony-informative. The analyses of the 1140-base-pair-long Cytb represent our primary results and are shown in Fig. 4. In addition to the Bayesian Inference analyses and the Maximum Likelihood analysis of the total Cytb data set (including the new sequences), we tested the impact of reduced data sets (569 characters and 747 characters, Bayesian Inference) and different partitioning schemes on the phylogenetic signal (BI-1140-unpart, BI-1140-part, ML-1140, BI-569-unpart, BI-747-unpart, BI-747-part; Table 4, Fig. 3, Figs. S2–S7).
We next re-analysed the complete mitochondrial genome alignment from Hassanin et al. (2012) for the subset of cervids (14904 base pairs, Bayesian Inference; BI-mtG, Fig. S1), because the authors stated that some of the nodes are not robust, as proven by previous re-analyses (Bibi, 2014). The re-analysis presented here (BI-mtG, Fig. S1) resulted in the support of a fully resolved topology, which is congruent with the topology in Hassanin et al. (2012).
Data partitioning of the 1140-base-pair-long Cytb data set and reduced data sets did not lead to contradictory results compared to unpartitioned analyses or larger data sets. Resolution and node supports generally decreased with decreasing alignment length (Fig. 3). Cervid lineages above the genus level were almost always recovered with all matrix sizes and partitioning schemes (Table 4). None of the topologies supportably contradicted each other; however, all topologies differed from each other to some extent at the tribe, genus, and/or species level. Compared to the Cytb-only topologies, the mitochondrial genome topology showed generally higher posterior probabilities (Figs. 3 and 4).
The monophyly of superordinate clades, Cervidae, Cervini, Muntiacini, and Capreolini (including Hydropotes), was supported in all topologies (Figs. 3 and 4, Figs. S1–S7, Table 4). In all but one topology (BI-569-unpart; Fig. 3G, Fig. S7), the monophyly of Cervinae, was consistently supported (Fig. 3, Table 4). Odocoileini was weakly supported in three topologies (ML-1140, BI-1140-unpart, BI-mtG; Figs. 3A, 3B , 3D and 4, Figs. S1, S2, S4 and Table 4). Capreolinae, however, was supported as a monophyly in only one topology (BI-mtG, Fig. 3A, Fig. S1), and in the other topologies, the taxon splits unresolved into Odocoileini, Rangiferini (Rangifer), Alceini (Alces), and Capreolini (Capreolus, Hydropotes) (Fig. 3). Alceini and Capreolini sometimes formed a clade (Figs. 3A, 3C, 3D, 3E and 3F) or were unresolved (Figs. 3B and 3G). Systematic relationships of capreoline taxa showed marginal differences in each of our topologies.
The results at the genus and species levels are shown in Fig. 4 and Figs. S1–S7. The newly sequenced Muntiacus atherodes nested within Muntiacini, mostly polytomous, with two Muntiacus-clades. One clade consisted of M. muntjak, M. feae, and M. crinifrons, and the other consisted of M. truongsonensis, M. putaoensis, M. rooseveltorum, M. reevesi, and M. vuquangensis. Two topologies (BI-1140-unpart, ML-1140) indicated a poorly supported sister taxon relationship between M. muntjak and M. atherodes (Fig. 4, Figs. S2 and S4).
We found strong support in Cervini to place all four Rusa marianna specimens in a Philippine Rusa-clade, with Rusa alfredi in all but one topology (BI-569-unpart; Fig. 4, Figs. S1–S7).
The newly sequenced Mazama chunyi is consistently placed as a sister taxon to M. gouazoubira, whereas the three M. bricenii specimens are primarily a sister taxon to M. rufina.
The four P. mephistophiles specimens always form a clade, which is either a sister taxon to or nested within Odocoileini. Interestingly, they are not placed in a sister position to the mitochondrial genome sequence labelled P. mephistophiles from Hassanin et al. (2012). In none of our topologies did P. mephistophiles and P. puda form a sister taxon relationship, which makes the monophyly of the genus questionable. M. nemorivaga, M. rufina, M. bricenii, P. puda, and particularly P. mephistophiles occasionally take up positions outside the above proposed clades, thus underpinning their yet unsolved systematics.
Regardless of the controversies debated here and elsewhere regarding Odocoileini molecular systematics, topologies (in the literature and here, Figs. 3 and 4, Figs. S1–S7) show two consistently occurring subclades carrying phylogenetic signal within Odocoileini (e.g., Gilbert, Ropiquet & Hassanin, 2006; Duarte, González & Maldonado, 2008; Hassanin et al., 2012). One subclade consists of Hippocamelus, Blastocerus, Ozotoceros, M. gouazoubira, M. chunyi, M. nemorivaga, and Pudu puda. The other subclade consists of Odocoileus, M. americana, M. bororo, M. nana, M. temama, M. pandora, M. rufina, and M. bricenii. Based on these results we establish two new subtribes Blastocerina and Odocoileina according to the rules of the ICZN (http://www.iczn.org/code). These two subtribes form the tribe Odocoileini and have Rangiferini as sister taxon.
Blastocerina subtribus nova
| Type genus: Blastocerus Wagner, 1844 |
| Higher taxa: Odocoileini—Capreolinae—Cervidae |
The subtribe Blastocerina consists of the following species: Blastocerus dichotomus, Hippocamelus antisensis, Hippocamelus bisulcus, Mazama chunyi, Mazama gouazoubira, Mazama nemorivaga, Ozotoceros bezoarticus, and Pudu puda (Fig. 4). Blastocerina refers to the clade originating from the most recent common ancestor of Blastocerus dichotomus (Illiger, 1815) and Pudu puda Molina, 1782. Pudu mephistophiles potentially falls within that clade, but more data are needed for a definite placement of this taxon.
Odocoileina subtribus nova
| Type genus: Odocoileus Rafinesque, 1832 |
| Higher taxa: Odocoileini—Capreolinae—Cervidae |
The subtribe Odocoileina consists of Mazama americana, Mazama bororo, Mazama bricenii, Mazama nana, Mazama pandora, Mazama rufina, Mazama temama, Odocoileus hemionus, and Odocoileus virginianus (Fig. 4). Odocoileina refers to the clade originating from the most recent common ancestor of Odocoileus virginianus (Von Zimmermann, 1778–1783) and Mazama bricenii Thomas, 1908.
Discussion
Phylogenetic analyses
Our results represent the most complete compilation of molecular data in terms of taxon sample for cervids to date. The thorough sampling enabled us to place the de novo sequenced species in topologies representing overall cervid systematics. We were able to solve some relationships but also discovered previously unknown issues. The data set excludes Muntiacus gongshanensis, for which only a very short tRNA sequence is available, and Axis calamianensis, M. montanus, M. puhoatensis, and M. vaginalis, for which no molecular data are available.
Our experiments with different matrix sizes, partitioning schemes, and models revealed that the resulting topologies do not dramatically differ from each other. However, we could observe that the resolution decreased with decreasing sequence length. All seven analyses recovered major clades within Cervidae (Table 4 and Fig. 3). These experiments were undertaken to single out strong phylogenetic signal and the significance thereof, which is consistent regardless of the data set sizes and parameter changes. We observed that taxa, which are generally unstable across topologies from different studies (e.g., Pitra et al., 2004; Gilbert, Ropiquet & Hassanin, 2006; Agnarsson & May-Collado, 2008; Hassanin et al., 2012), were the first to lose a supported systematic position with decreasing sequence length (Fig. 3 and Table 4). The partitioning scheme and model choice did not make as much difference as did the matrix size. As expected, partitioning did not necessarily lead to better resolved topologies or significantly better supported clades. However, some differences were observed comparing maximum likelihood with Bayesian inference methods (Figs. 3 and 4).
The topology resulting from re-analysis of the mitochondrial genome sequences (BI-mtG) representing the largest sequence length is fully resolved and has the highest overall support values. The shortest data set (BI-569-unpart), although less well resolved, recovered all higher-level lineages and is in most points congruent with the other topologies based on larger data sets (Table 4 and Fig. 3). These different analyses enabled us to examine the significance of the individual resulting topologies.
Muntiacus atherodes
The species diversity of Muntiacini is the least covered among cervid subclades in molecular phylogenetic analyses. Muntiacini comprises muntjacs (Muntiacus) and the tufted deer (Elaphodus), includes the smallest members of Cervinae (40 to 70 cm shoulder height), and inhabits Southeast Asia and Eastern China (Mattioli, 2011). The systematic relationships within Muntiacini in our topologies (Fig. 4) are largely congruent with most recent studies and are the least controversial in molecular cervid systematics (e.g., Pitra et al., 2004; Gilbert, Ropiquet & Hassanin, 2006; Agnarsson & May-Collado, 2008; Hassanin et al., 2012). Here, M. crinifrons and M. feae are always sister taxa, and when the resolution is sufficiently high, M. muntjak is a sister taxon to both of them. In our topologies, M. putaoensis, M. rooseveltorum, M. truongsonensis, and M. vuquangensis always form a clade. Most often, with M. reevesi is a sister taxon to that clade, but occasionally, M. reevesi is sister taxon to all other muntjacs (BI-747-part, BI-569-unpart). Due to the consistent position of M. muntjak 2 (AF042718) as sister taxon to M. truongsonensis, we suggest re-confirming this sequence.
The monotypic Elaphodus cephalophus, which is distributed in southeast China, is always a sister taxon to all muntjacs in both our topologies and previously published trees (Pitra et al., 2004; Gilbert, Ropiquet & Hassanin, 2006; Agnarsson & May-Collado, 2008; Hassanin et al., 2012).
Because of the presumed primitive antler morphology of M. atherodes (Groves & Grubb, 1982), its systematic position was hypothesised to be between Elaphodus cephalophus and the Muntiacus-clade, which is not supported by our results. The newly sequenced holotype specimen of M. atherodes is nested within muntjacs, unresolved in a polytomy in most of our topologies. However, some results indicate a potential closer relationship to M. muntjak than to any other muntjac. The predominant separate placement from all other Muntiacus spp. is an interesting outcome that strengthens the species status of M. atherodes.
Several authors assumed the sympatric existence of a second muntjac species on Borneo that was separate from M. muntjak (Kohlbrugge, 1895; Lyon Jr, 1911; Van Bemmel, 1952; Hill, 1960) before Groves & Grubb (1982) eventually established M. atherodes based on a skin and the holotype skull sampled for the present study. The endemic M. atherodes differs from M. muntjak in colouration and has smaller, simpler antlers, and the latter has a much wider distribution across Southeast Asia and Southern China (Groves & Grubb, 1982).
Though unsupported, the potential close systematic relationship of M. atherodes and M. muntjak would be logical based on the endemic occurrence of M. atherodes on Borneo. M. atherodes and M. muntjak could have diverged from a common ancestor on Borneo via sympatric speciation and with a later invasion of M. muntjak to the mainland.
Alternatively, M. muntjak could have invaded Borneo during the sea level fluctuations in the Plio-Pleistocene (Voris, 2000; Meijaard, 2003; Woodruff, 2003; Meijaard & Groves, 2004; Bibi & Métais, 2016), resulting in the allopatric speciation of M. atherodes and its isolation from the mainland populations during the end-Pleistocene sea level rise.
The high sea levels in the early Pliocene split the Thai-Malayan Peninsula into two landmasses, which separated Indochinese from Sundaic faunas (Woodruff, 2003). This most likely had a large influence on the evolution of Southeast Asian cervids and probably occurred again later during the Pliocene (Meijaard & Groves, 2004). Sea level changes in the Malay Archipelago were important for faunal dispersals. Low sea levels allowed species to spread to landmasses, which would become islands with rising sea levels, resulting in isolation of populations.
Detailed descriptions and maps for sea level changes of Southeast Asia can be viewed in Voris (2000) and Meijaard (2003).
Rusa marianna
In the literature, there is a broad consensus about the systematic relationships within Cervini. However, the taxonomy of Cervus s. l. is indeed complicated (Randi et al., 2001). The controversy primarily concerns delimitations of genera and/or subgenera. Rusa, Rucervus, Przewalskium (= Cervus) albirostris, and Cervus are occasionally treated as subgenera of the genus Cervus, whereas Axis, Elaphurus, and Dama are normally treated as separate genera (Groves & Grubb, 1987; Randi et al., 2001). Here, we refer to Rucervus and Rusa as individual genera and refer to Przewalskium albirostris as Cervus albirostris.
The four species of Rusa, R. alfredi, R. marianna, R. timorensis, R. unicolor, inhabit India, Indochina and the Malay-Archipelago (Grubb & Groves, 1983; Mattioli, 2011). R. unicolor is the largest oriental deer and has a highly fragmentary distribution from southern Nepal, India and Sri Lanka along the southern Himalayas through to mainland Southeast Asia and many of the Greater Sunda islands (Timmins et al., 2008; Leslie, 2011). R. timorensis is endemic to the Indonesian islands Bali and Java (Hedges et al., 2008). Rusa alfredi is one of the rarest deer species according to the IUCN Red List (IUCN, 2015) and is endemic to Panay and Negros (Western Visayan Islands, Central Philippines) (Oliver et al., 2008). In contrast, Rusa marianna is more widely distributed across most of the Philippine Islands, with the exceptions of the Negros-Panay, Sulu and Palawan Faunal Region, the Babuyan/Batanes groups, and other isolated islets (MacKinnon, Ong & Gonzales, 2008).
The four newly sequenced individuals of Rusa marianna are positioned to be closely related to each other in a distinct clade. Two of the individuals are in a polytomy with the other Philippine species, Rusa alfredi, and two form a clade, which is a sister taxon to the polytomy (Fig. 4). Our topology supports the hypothesis that the two Philippine Rusa species are closely related and are sister taxon to R. timorensis and R. unicolor.
Investigations by Grubb & Groves (1983) showed that interpreted relationships within Rusa are controversial. Rusa timorensis and R. unicolor are sister taxa supported in all our topologies (Fig. 4, Figs. S1–S7), and this clade is in a polytomy with the Cervus-clade (including C. albirostris) and the R. alfredi-R. marianna-clade. A close relationship between Rusa and C. albirostris was already suggested by Flerov (1952) based on morphological evidence and a supposed divergence of C. albirostris from Rusa in the Late Pliocene.
The evident phenotypic separation of spotted (R. alfredi) and non-spotted (R. marianna) Rusa deer on the Philippines suggests two invasion events (Grubb & Groves, 1983), but the missing molecular data for R. marianna have prohibited further explanations. Grubb & Groves (1983) suggested a Southeast Asian mainland common ancestor from which a peripheral population diverged by evolving into R. timorensis. Later, a population of those colonised the Philippines twice at early and later stages in diversification, evolving into R. alfredi and R. marianna. R. unicolor evolved there but failed a third colonisation on additional Philippine Islands and dispersed northwards to the mainland. Meijaard & Groves (2004) pointed to the likely high impact of Plio-Peistocene sea level fluctuations on Southeast Asian cervid dispersal and speciation.
However, the suggested speciation of R. marianna and R. alfredi is not clearly evident from our topologies, where R. alfredi appears to be a subgroup of R. marianna rather than a sister taxon. More data are needed to unambiguously solve their relationships.
Odocoileini
Odocoileini represents the most controversial subclade of extant cervids. They consistently split into two subclades in both our current results and previously published phylogenetic trees. For these two subclades we established the new subtribes Blastocerina and Odocoileina (see above). However, within each of these subclades, systematic relationships are not yet solved. The recent divergence of modern neotropical Odocoileini from extinct Eurasian Capreolinae and related insufficient genomic diversity available to solve systematic relationships could be the reason (Vislobokova, 1980). All genera except for Odocoileus are endemic to South America, and their ancestors reached the continent via the Panamanian Isthmus in the Pliocene (5–2.5 million years ago) (Webb, 2000; Gilbert, Ropiquet & Hassanin, 2006). The first fossil appearances are known from no longer than approximately 2.4 million years ago (Webb, 2000). The consistent split of Blastocerina and Odocoileina potentially represents an asynchronous dispersal history via two invasion events.
Furthermore, our study revealed dubious relationships between available Hippocamelus sequences. All of our topologies (Fig. 4, Figs. S2–S7) show that two H. antisensis sequences (H. antisensis 1; JN632646, NC_020711 (Hassanin et al., 2012)) are a sister taxon to H. bisulcus. However, the other two sequences (H. antisensis 2; DQ379307 (Gilbert, Ropiquet & Hassanin, 2006) and GU190862 (Fuentes-Hurtado et al., 2011)), are a sister taxon to Ozotoceros in all of our topologies (Fig. 4, Figs. S2–S7). This is a critical issue, although its resolution is beyond the scope of this study; however, we found it important to point to this drawback in the base data and suggest re-confirmation of all four sequences.
Systematics of the two dwarfed genera, Mazama and Pudu, whose small body size and simplified antlers are interpreted as secondary adaptations to dense vegetation (Geist, 1998; Mattioli, 2011), are particularly uncertain. Their habitat use and their decline in individual numbers makes it increasingly difficult to obtain enough data to resolve systematic issues from some of the species (see below).
Pudu
Pudus are the smallest living deer (25 to 40 cm shoulder height) and the smallest New World hoofed mammals (Hershkovitz, 1982; Mattioli, 2011). It is difficult to distinguish both pudu species from sympatric small deer species (Mazama) based only on the phenotype, without direct comparison (Hershkovitz, 1982; Jiménez, 2011). Pudu and Mazama likely represent divergent lineages of small odocoilein deer (Hershkovitz, 1982). Although the origin of pudus is unknown, Hershkovitz (1982) stated that P. mephistophiles has more primitive phenotypical features than P. puda.
Pudu was assumed to be polyphyletic (Hassanin et al., 2012). Whereas P. puda has been well-sampled and studied, information for P. mephistophiles is scarce. In all of our topologies (Fig. 4, Figs. S1–S7), the four newly sequenced specimens of Pudu mephistophiles, including the holotype, form a well-supported clade. However, the position of that clade is variable. In four topologies (BI-1140-unpart, BI-747-part, BI-747-unpart, BI-569-unpart; Fig. 4, Figs. S2, S5, S6 and S7), the clade is a sister taxon to all other Odocoileini and Rangiferini; in one topology (ML-1140; Fig. S4), it is a sister taxon to all Blastocerina with poor support; and in one topology (BI-1140-part; Fig. 3C, Fig. S3), it is placed in an unresolved position with other Odocoileini clades and Rangiferini. The placement of the individual Pudu mephistophiles specimen published prior to our study in Hassanin et al. (2012) (JN632691) is not close to the P. mephistophiles-clade in our topologies. Instead, it is placed as a sister taxon to Mazama rufina (Fig. 4, Figs. S1–S7) and confirms Hassanin et al.’s (2012) suspicion that it might in fact be a misidentified Mazama rufina and is neglected for further interpretation. The holotype specimen included in the four new P. mephistophiles samples substantiates that suspicion. In all but one topology (BI-569-unpart), P. puda is a sister taxon to all other Blastocerina, which is congruent with Hassanin et al. (2012) and Agnarsson & May-Collado (2008). In Duarte, González & Maldonado (2008), however, its position was unresolved. The placement of P. mephistophiles separate from its congeneric P. puda in most topologies suggests polyphyly of the genus.
Mazama
The genus Mazama comprises several species of small- to medium-sized deer (40 to 80 cm shoulder height) (Hershkovitz, 1959; Hershkovitz, 1982; Mattioli, 2011). The current distribution of Mazama ranges from Southern Mexico to Argentina (IUCN Red List, Mattioli, 2011; González et al., 2009).
Since the first description of Mazama pita Rafinesque, 1817 (= Moschus americanus Erxleben, 1777), the genus has been subject to taxonomic controversies. Allen (1915) recognised 18 species of Mazama; Cabrera (1960) reduced these to four species, i.e., M. chunyi, M. gouazoubira, M. nana, and M. rufina. Czernay (1987) established two more species, M. americana and M. bricenii, whereas Groves & Grubb (1987) considered M. temama a possible separate species based on cytogenetic differences. Medellín, Gardner & Marelo Aranda (1998) revised M. pandora as a separate species based on differences in the skulls and skins. Rossi (2000) established M. nemorivaga as a fourth sympatric species in Brazil (together with M. americana, M. nana, M. gouazoubira). Duarte (1992) described M. bororo based on karyotype differences, which adds up to ten Mazama species being widely accepted today (IUCN Red List, Mattioli, 2011; González et al., 2009). More recently, Abril & Duarte (2008) recognised only eight species (M. americana, M. bororo, M. chunyi, M. gouazoubira, M. nana, M. nemorivaga, M. pandora, and M. rufina), whereas Groves & Grubb (2011) listed 24 different species of Mazama. Most of the species share phenotypic similarities, which makes their discrimination almost impossible; however, there are differences in overall body size, coat colour, and/or karyotype (González et al., 2009).
Recently, polyphyly of Mazama was observed (Duarte, González & Maldonado, 2008; Hassanin et al., 2012). Within Odocoileina, Duarte, González & Maldonado (2008) found a separation of the genus into a mixed Mazama americana-clade that included M. bororo and M. nana. M. americana appeared polyphyletic because there was an additional clade consisting exclusively of M. americana as a sister taxon to Odocoileus and the mixed M. americana-clade (Duarte, González & Maldonado, 2008). Hassanin et al. (2012) found M. americana to be monophyletic and a sister taxon to Odocoileus. M. rufina is a sister taxon to the Mazama-Odocoileus-clade (Hassanin et al., 2012).
Within Blastocerina there were two clades: a Mazama gouazoubira-clade and a M. nemorivaga-clade. Their position varies from study to study (Agnarsson & May-Collado, 2008; Duarte, González & Maldonado, 2008; Hassanin et al., 2012).
In our topologies, within Odocoileina, the mixed Mazama americana-clade that includes the sequences indicated as M. americana 1–3 is supported (Fig. 4) and has the most stable position, forming the sister taxon to the Odocoileus-clade. The pure M. americana-clade found by Duarte, González & Maldonado (2008) is represented in our topology by the sequences indicated as M. americana 4 and M. americana 5.
M. rufina is nested within Odocoileina and is a sister taxon to the Mazama-Odocoileus-clade (BI-1140-unpart, BI-1140-part, ML-1140; Figs. 3 and 4, Figs. S2, S3 and S4) or is placed in resolved or unresolved positions outside Odocoileina but within Odocoileini (BI-747-unpart, BI-747-part, BI-569-unpart; Fig. 3, Figs. S5, S6 and S7).
M. gouazoubira is either a sister taxon to both Hippocamelus species (BI-747-unpart, BI-569-unpart; Fig. 4, Figs. S5 and S7), or Blastocerus is placed between Hippocamelus and M. gouazoubira. M. gouazoubira itself is polyphyletic in our topologies (Fig. 4), and a re-confirmation of the M. gouzoubira 2 sequence (DQ379308 (Gilbert, Ropiquet & Hassanin, 2006)) is suggested.
Finally, the M. nemorivaga-clade is mostly nested within Blastocerina or is placed unresolved within Odocoileini (BI-747-part, BI-569-unpart).
In our study, M. temama and M. pandora were included in a species-rich phylogenetic analysis of cervids with palaearctic and neotropical species for the first time. Similarly to recent results of Escobedo-Morales et al., 2016, our results show that M. temama is always within Odocoileina as a sister taxon to the mixed M. americana-clade. In Escobedo-Morales et al., 2016 and in our topologies, M. pandora is consistently placed within Odocoileina as a sister taxon to Odocoileus.
This also indicates a critical issue concerning the dispersal history of South American cervids. The placement of the M. americana-splits in Fig. 4 can be alternatively interpreted as a paraphyletic M. americana-clade, within which all other species are nested, i.e., Odocoileus sp., M. pandora, M. temama, M. nana, and M. bororo. However, the placement of M. temama disrupts the continuous genealogy of M. americana. Together with the clade consisting of M. rufina and M. bricenii (see below), Odocoileina is basically a Mazama-clade, within which Odocoileus diverged and Mazama diversified into several species. This scenario would strongly question the long-held assumption that Odocoileus was the first cervid to immigrate to South America and diversify into the extant South American species (Anderson & Wallmo, 1984; Smith, 1991; Geist, 1998) (see also Escobedo-Morales et al., 2016).
Our results from sequencing M. chunyi show a sister taxon relationship with M. gouazoubira within Blastocerina in all our topologies (Fig. 4). The newly sequenced Mazama bricenii specimens are always placed in a sister taxon position to M. rufina in our topologies but exist as a monophyletic group in only one topology (BI-569-unpart; Fig. 3, Fig. S7).
In two topologies, the specimen BMNH 1908.6.24.5 is placed isolated from the other two specimens (BMNH 1913.4.24.3, BMNH 1934.9.10.228), which remain sister taxa to M. rufina. Specifically, in one topology, BMNH 1908.6.24.5 is in an unresolved position within Odocoileina (BI-747-part; Fig. 3, Fig. S6) and is positioned as a sister taxon to M. chunyi in the other topology (BI-1140-part; Fig. 3, Fig. S3).
Mattioli (2011) listed M. bricenii and M. chunyi as subspecies of M. rufina. The Mazama bricenii specimen BMNH 1934.9.10.228 was originally assigned to M. rufina. Additionally, its sampling locality in Ecuador is outside the assumed current distribution of M. bricenii (Fig. 2 and Table 2) and thus makes the revised affiliation to M. bricenii questionable. M. bricenii is scarcely distributed in Northeast Colombia and West Venezuela, whereas M. rufina is distributed along the Andes from central Colombia to Ecuador and North Peru (Weber & González, 2003; Lizcano, Álvarez & Delgado-V, 2010). This distribution is intermediate between the distribution of M. bricenii and M. chunyi. The latter is certainly known from South Peru and North Bolivia based on isolated museum specimen localities and rare sightings in the wild. Equally scarce is information on the biology and ecology of these species (Rumiz & Pardo, 2010). The results of the most recent study on systematic relationships of M. bricenii based on Cytb confirm our results and suggest that M. bricenii is a junior synonym of M. rufina (Gutiérrez et al., 2015).
Despite the extensive taxonomic and phylogenetic interest in the genus Mazama due to unsolved questions, the taxon remains enigmatic (e.g., Duarte & Merino, 1997; Medellín, Gardner & Marelo Aranda, 1998; Duarte & Jorge, 2003; Weber & González, 2003; Duarte, González & Maldonado, 2008; González et al., 2009). In particular, the high intraspecific variability in M. americana and M. gouazoubira stimulated additional taxonomic and genetic research on the genus (see Weber & González, 2003). The systematics of M. americana is particularly problematic because even the species appears polyphyletic with possible cryptic species (Duarte, González & Maldonado, 2008; Abril et al., 2010). Abril et al. (2010) showed that M. americana exhibits an extensive karyotype variation and found two distinct clades within M. americana sampled across Brazil. They also found that one clade is more closely related to M. bororo and M. nana, presumably corresponding to M. americana 1–3 in our topology, than to the second (pure) clade of M. americana (Fig. 4). Additionally, the genetic distance between the M. americana-clades was higher than that between M. nana and M. bororo. This suggests two separation events in the two lineages of M. americana (Abril et al., 2010). There is the potential that even more species are hidden in both the M. americana-complex and the M. gouazoubira-complex (Weber & González, 2003). Cytogenetics seems to be the most reliable technique for distinguishing between sympatric species (Vogliotti & Duarte, 2009). Much more data and thorough research on Mazama are needed to shed additional light on their complex systematic relationships.
Conclusion
The taxonomically most extensive molecular phylogenetic data set for cervids compiled to date enabled us to undertake phylogenetic analyses to answer and test the initial questions and hypotheses: (1) Mazama bricenii is closely related to M. rufina and is more closely related to the M. americana-clade than to the M. gouazoubira-clade. However, from our topology, we infer that M. rufina is a subclade of M. bricenii. It cannot be excluded that these two taxa may represent the same species with M. rufina as the senior synonym. Mazama chunyi forms a sister taxon relationship with M. gouazoubira and can thus be assigned to the M. gouazoubira-clade. The discovery of a fifth clade (M. pandora) shows that the polyphyly and systematic relationships within Mazama are even more complex than previously thought and remain a challenge to address in future research. (2) Muntiacus atherodes is supported to be a valid species distinct from other Muntiacus spp. However, its systematic position cannot be resolved with certainty, but the maximum likelihood analysis indicates that it might be more closely related to the sympatric M. muntjak than to any other muntjac. (3) The Philippine rusine deer R. marianna and R. alfredi form a monophyletic clade and are sister taxon to a clade containing the other rusine deer, R. timorensis and R. unicolor and to the Cervus-clade. Our results indicate that R. alfredi forms a subclade of R. marianna rather than its sister taxon. (4) The genus Pudu appears to be polyphyletic, with P. puda nested within the Blastocerina and P. mephistophiles, thereby forming a monophyletic group in a yet-unresolved position.
Based on our topologies and previous work, we established here the new subtribes Blastocerina and Odocoileina, which form Odocoileini. A revision of the current taxonomy based on comparison of phenotypic and genotypic traits is desirable for future research on cervid systematics.
Supplemental Information
Supplementary Information
This file contains the figures of the resulting topologies from all undertaken phylogenetic analyses in this study.
Matrix
This file contains the full 1,140 base pair long cytochrome b data matrix.
