Markets
All of the World’s Money and Markets in One Visualization


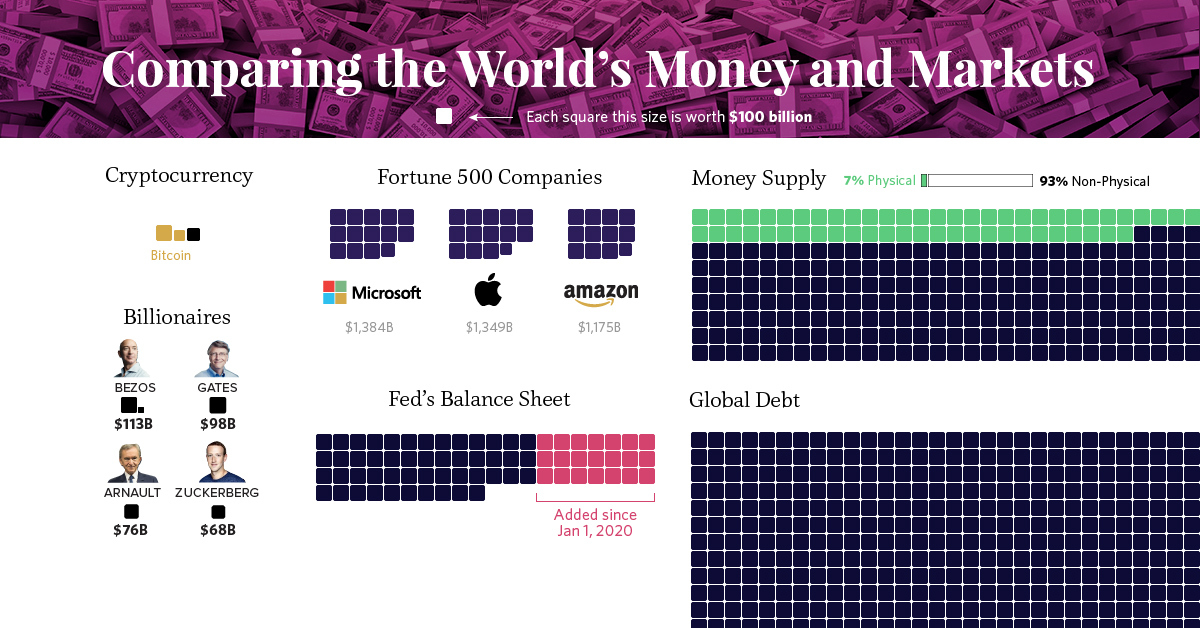
All of the World’s Money and Markets in One Visualization
In the current economic circumstances, there are some pretty large numbers being thrown around by both governments and the financial media.
The U.S. budget deficit this year, for example, is projected to hit $3.8 trillion, which would be more than double the previous record set during the financial crisis ($1.41 trillion in FY2009). Meanwhile, the Fed has announced “open-ended” asset-buying programs to support the economy, which will add even more to its current $7 trillion balance sheet.
Given the scale of these new numbers—how can we relate them back to the more conventional numbers and figures that we may be more familiar with?
Introducing the $100 Billion Square
In the above data visualization, we even the playing field by using a common denominator to put the world’s money and markets all on the same scale and canvas.
Each black square on the chart is worth $100 billion, and is not a number to be trifled with:
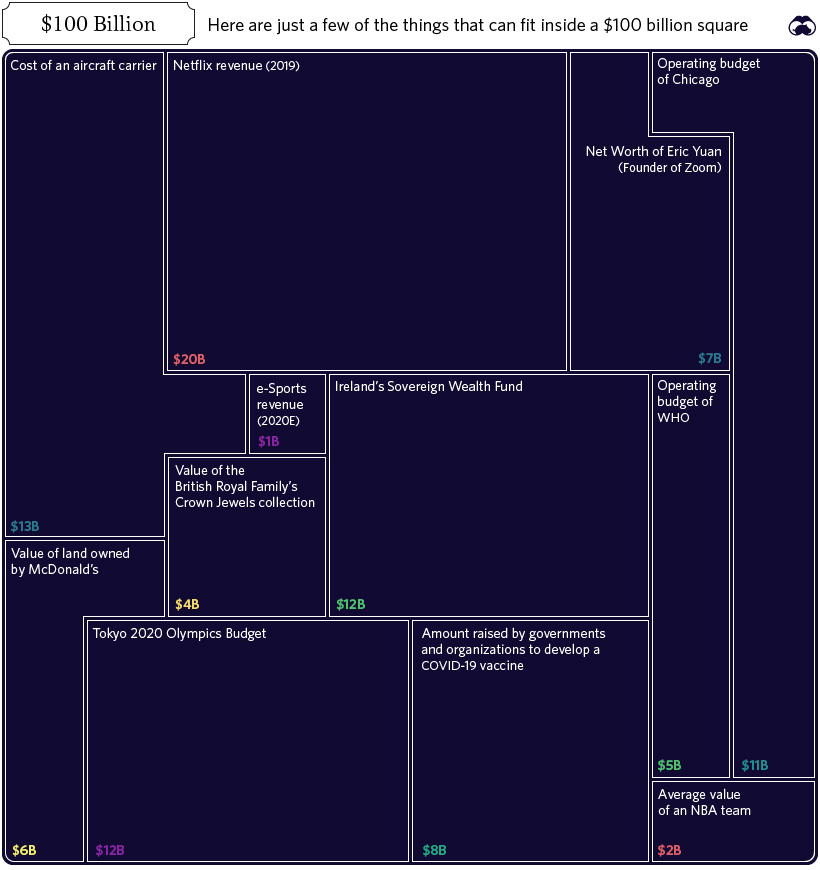
In fact, the entire annual GDP of Cuba could fit in one square ($97 billion), and the Greek economy would be roughly two squares ($203 billion).
Alternatively, if you’re contrasting this unit to numbers found within Corporate America, there are useful comparisons there as well. For example, the annual revenues of Wells Fargo ($103.9 billion) would just exceed one square, while Facebook’s would squeeze in with room to spare ($70.7 billion).
Billions, Trillions, or Quadrillions?
Here’s our full list, which sums up all of the world’s money and markets, from the smallest to the biggest, along with sources used:
| Category | Value ($ Billions, USD) | Source |
|---|---|---|
| Silver | $44 | World Silver Survey 2019 |
| Cryptocurrencies | $244 | CoinMarketCap |
| Global Military Spending | $1,782 | World Bank |
| U.S. Federal Deficit (FY 2020) | $3,800 | U.S. CBO (Projected, as of April 2020) |
| Coins & Bank Notes | $6,662 | BIS |
| Fed's Balance Sheet | $7,037 | U.S. Federal Reserve |
| The World's Billionaires | $8,000 | Forbes |
| Gold | $10,891 | World Gold Council (2020) |
| The Fortune 500 | $22,600 | Fortune 500 (2019 list) |
| Stock Markets | $89,475 | WFE (April 2020) |
| Narrow Money Supply | $35,183 | CIA Factbook |
| Broad Money Supply | $95,698 | CIA Factbook |
| Global Debt | $252,600 | IIF Debt Monitor |
| Global Real Estate | $280,600 | Savills Global Research (2018 est.) |
| Global Wealth | $360,603 | Credit Suisse |
| Derivatives (Market Value) | $11,600 | BIS (Dec 2019) |
| Derivatives (Notional Value) | $558,500 | BIS (Dec 2019) |
| Derivatives (Notional Value - High end) | $1,000,000 | Various sources (Unofficial) |
Derivatives top the list, estimated at $1 quadrillion or more in notional value according to a variety of unofficial sources.
However, it’s worth mentioning that because of their non-tangible nature, the value of financial derivatives are measured in two very different ways. Notional value represents the position or obligation of the contract (i.e. a call to buy 100 shares at the price of $50 per share), while gross market value measures the price of the derivative security itself (i.e. $1.00 per call option, multiplied by 100 shares).
It’s a subtle difference that manifests itself in a big way numerically.
Correction: Graphic updated to reflect the average value of an NBA team.


Economy
Economic Growth Forecasts for G7 and BRICS Countries in 2024
The IMF has released its economic growth forecasts for 2024. How do the G7 and BRICS countries compare?


G7 & BRICS Real GDP Growth Forecasts for 2024
The International Monetary Fund’s (IMF) has released its real gross domestic product (GDP) growth forecasts for 2024, and while global growth is projected to stay steady at 3.2%, various major nations are seeing declining forecasts.
This chart visualizes the 2024 real GDP growth forecasts using data from the IMF’s 2024 World Economic Outlook for G7 and BRICS member nations along with Saudi Arabia, which is still considering an invitation to join the bloc.
Get the Key Insights of the IMF’s World Economic Outlook
Want a visual breakdown of the insights from the IMF’s 2024 World Economic Outlook report?
This visual is part of a special dispatch of the key takeaways exclusively for VC+ members.
Get the full dispatch of charts by signing up to VC+.
Mixed Economic Growth Prospects for Major Nations in 2024
Economic growth projections by the IMF for major nations are mixed, with the majority of G7 and BRICS countries forecasted to have slower growth in 2024 compared to 2023.
Only three BRICS-invited or member countries, Saudi Arabia, the UAE, and South Africa, have higher projected real GDP growth rates in 2024 than last year.
| Group | Country | Real GDP Growth (2023) | Real GDP Growth (2024P) |
|---|---|---|---|
| G7 | 🇺🇸 U.S. | 2.5% | 2.7% |
| G7 | 🇨🇦 Canada | 1.1% | 1.2% |
| G7 | 🇯🇵 Japan | 1.9% | 0.9% |
| G7 | 🇫🇷 France | 0.9% | 0.7% |
| G7 | 🇮🇹 Italy | 0.9% | 0.7% |
| G7 | 🇬🇧 UK | 0.1% | 0.5% |
| G7 | 🇩🇪 Germany | -0.3% | 0.2% |
| BRICS | 🇮🇳 India | 7.8% | 6.8% |
| BRICS | 🇨🇳 China | 5.2% | 4.6% |
| BRICS | 🇦🇪 UAE | 3.4% | 3.5% |
| BRICS | 🇮🇷 Iran | 4.7% | 3.3% |
| BRICS | 🇷🇺 Russia | 3.6% | 3.2% |
| BRICS | 🇪🇬 Egypt | 3.8% | 3.0% |
| BRICS-invited | 🇸🇦 Saudi Arabia | -0.8% | 2.6% |
| BRICS | 🇧🇷 Brazil | 2.9% | 2.2% |
| BRICS | 🇿🇦 South Africa | 0.6% | 0.9% |
| BRICS | 🇪🇹 Ethiopia | 7.2% | 6.2% |
| 🌍 World | 3.2% | 3.2% |
China and India are forecasted to maintain relatively high growth rates in 2024 at 4.6% and 6.8% respectively, but compared to the previous year, China is growing 0.6 percentage points slower while India is an entire percentage point slower.
On the other hand, four G7 nations are set to grow faster than last year, which includes Germany making its comeback from its negative real GDP growth of -0.3% in 2023.
Faster Growth for BRICS than G7 Nations
Despite mostly lower growth forecasts in 2024 compared to 2023, BRICS nations still have a significantly higher average growth forecast at 3.6% compared to the G7 average of 1%.
While the G7 countries’ combined GDP is around $15 trillion greater than the BRICS nations, with continued higher growth rates and the potential to add more members, BRICS looks likely to overtake the G7 in economic size within two decades.
BRICS Expansion Stutters Before October 2024 Summit
BRICS’ recent expansion has stuttered slightly, as Argentina’s newly-elected president Javier Milei declined its invitation and Saudi Arabia clarified that the country is still considering its invitation and has not joined BRICS yet.
Even with these initial growing pains, South Africa’s Foreign Minister Naledi Pandor told reporters in February that 34 different countries have submitted applications to join the growing BRICS bloc.
Any changes to the group are likely to be announced leading up to or at the 2024 BRICS summit which takes place October 22-24 in Kazan, Russia.
Get the Full Analysis of the IMF’s Outlook on VC+
This visual is part of an exclusive special dispatch for VC+ members which breaks down the key takeaways from the IMF’s 2024 World Economic Outlook.
For the full set of charts and analysis, sign up for VC+.

-

 Markets1 week ago
U.S. Debt Interest Payments Reach $1 Trillion
-

 Business2 weeks ago
Charted: Big Four Market Share by S&P 500 Audits
-

 Real Estate2 weeks ago
Ranked: The Most Valuable Housing Markets in America
-

 Money2 weeks ago
Which States Have the Highest Minimum Wage in America?
-

 AI2 weeks ago
Ranked: Semiconductor Companies by Industry Revenue Share
-

 Markets2 weeks ago
Ranked: The World’s Top Flight Routes, by Revenue
-

 Demographics2 weeks ago
Population Projections: The World’s 6 Largest Countries in 2075
-

 Markets2 weeks ago
The Top 10 States by Real GDP Growth in 2023